
After record injections, natural gas storage levels now within 7% of 5-year average
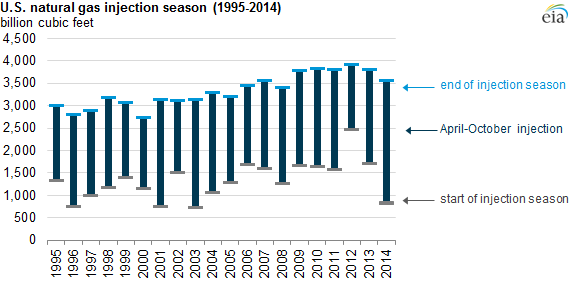
Working natural gas in storage ended October at 3,571 billion cubic feet (Bcf), a record increase of 2,734 Bcf during the April 1 to October 31 injection season, and within 7% of the average of the last five end-of-season storage levels. While end-October natural gas stocks are at a five-year low, increased natural gas production, which has reached an all-time high, and new pipeline projects will help meet winter natural gas demand. Higher production means that even if this winter were as cold as last year, EIA expects that natural gas storage at the end of March 2015 will be above its March 2014 level.
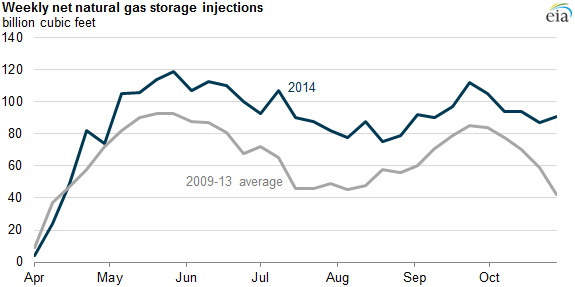
Heading into the refill season last spring, inventories were at an 11-year low after a prolonged and severe winter, about 1,000 Bcf lower than the five-year (2009-13) average. Although the refill season began slowly in April, injections quickly ramped up and exceeded five-year average levels for 28 weeks in a row. The gap between the five-year average and current inventories has now narrowed to 261 Bcf. Analysts often refer to the injection season as ending on October 31, but the peak in storage inventories may come later, as it is common for injections to continue into November.
High levels of injections over the summer were possible because of relatively low natural gas demand from the electric power sector as well as substantial increases in domestic natural gas production. Relatively mild summer temperatures led to lower than expected demand for air conditioning, allowing natural gas to go to underground storage facilities rather than to electric power generators. Bentek data from April through October indicate consumption of natural gas in the electric power sector averaged about 2% less than last year's level and roughly 16% below its level during the summer of 2012.
The October Short-Term Energy Outlook projects inventories will drop to 1,532 Bcf by the end of the heating season on March 31, 2015. This projection is based on National Oceanic and Atmospheric Administration (NOAA) projections for relatively normal winter weather with temperatures much milder than the winter of 2013-14. Even if the weather this winter matches last year's cold temperatures, it is unlikely that stocks would drop to March 2014 levels (when inventories were at an 11-year low). This is largely because of the gains in domestic natural gas production. As of August 2014, dry natural gas production was 3.5 Bcf/d greater than the same month last year. Continued high levels of production expected through next spring will also help reduce the need to withdraw natural gas from storage over the upcoming winter.
Falling natural gas prices have reflected this increase in supply. Following sustained cold weather this past winter, daily spot prices at the Henry Hub benchmark rose to six-year highs in February, spiking above $7 per million British thermal units on three separate occasions. Prices have declined over the past several months, as weekly inventory additions have been consistently high and production continues to rise.
Principal contributor: Katie Teller