Natural gas storage deficit to five-year average continues to narrow
Republished September 12, 2014, 10:20 a.m., the end date on the second graph was corrected.
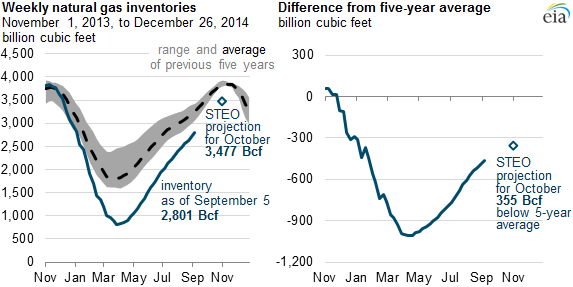
Storage injections have continued to outpace the five-year (2009-13) average this summer, with inventories as of September 5 at 2,801 billion cubic feet (Bcf), according to data from the Weekly Natural Gas Storage Report (WNGSR). The winter of 2013-14 led to a large drawdown in inventories, with stocks ending March 2014 almost 1 trillion cubic feet (Tcf) lower than the five-year average and at their lowest end-March level since 2003. Relatively higher weekly net injections into storage reduced that deficit to 463 Bcf as of September 5.
EIA's latest Short-Term Energy Outlook (STEO) expects that this trend will continue, with forecast inventories of 3,477 Bcf by the end of October, 355 Bcf below the five-year average and the lowest end-October level since 2008. However, the effect of these lower inventories on winter natural gas markets is expected to be mitigated by increasing new production, as evidenced by decreasing seasonality in natural gas futures contracts.
Although the injection season began slowly, injections have exceeded their average comparable-week levels in each week since April 18. Strong domestic production growth and mild demand have supported strong injections through the summer. Dry natural gas production grew to 70.2 billion cubic feet per day (bcf/d) in June, up nearly 6% from 66.4 bcf/d in June 2013, while mild weather reduced natural gas use for electric generation. Natural gas prices have also fallen during the injection season.
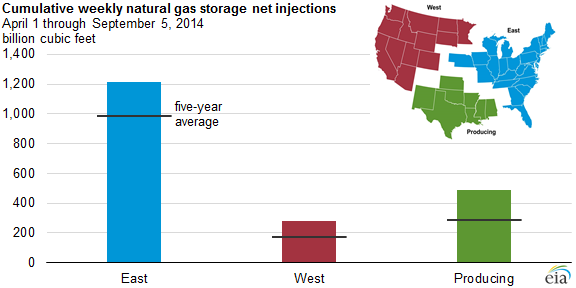
Working natural gas injections since April 1 are above the five-year average in every region: 24% higher in the East, 53% higher in the West, and 69% higher in the Producing region. STEO projects that East region inventories will have gone from 58% below the five-year average at the end of March, to 9% below the five-year average at the end of October. West region inventories will have gone from 45% below the five-year average to 2% below the five-year average, and Producing region inventories will have gone from 53% below the five-year average to 15% below the five-year average in that time.
Principal contributor: Katie Teller
Tags: inventories/stocks, natural gas, storage