Menu
Crude oil, gasoline, heating oil, diesel, propane, and other liquids including biofuels and natural gas liquids.
Exploration and reserves, storage, imports and exports, production, prices, sales.
Sales, revenue and prices, power plants, fuel use, stocks, generation, trade, demand & emissions.
Energy use in homes, commercial buildings, manufacturing, and transportation.
Reserves, production, prices, employment and productivity, distribution, stocks, imports and exports.
Includes hydropower, solar, wind, geothermal, biomass and ethanol.
Uranium fuel, nuclear reactors, generation, spent fuel.
Comprehensive data summaries, comparisons, analysis, and projections integrated across all energy sources.
Monthly and yearly energy forecasts, analysis of energy topics, financial analysis, congressional reports.
Financial market analysis and financial data for major energy companies.
Greenhouse gas data, voluntary reporting, electric power plant emissions.
Maps, tools, and resources related to energy disruptions and infrastructure.
State energy information, including overviews, rankings, data, and analyses.
Maps by energy source and topic, includes forecast maps.
International energy information, including overviews, rankings, data, and analyses.
Regional energy information including dashboards, maps, data, and analyses.
Tools to customize searches, view specific data sets, study detailed documentation, and access time-series data.
EIA's free and open data available as API, Excel add-in, bulk files, and widgets
Come test out some of the products still in development and let us know what you think!
EIA's open source code, available on GitHub.
Forms EIA uses to collect energy data including descriptions, links to survey instructions, and additional information.
Sign up for email subscriptions to receive messages about specific EIA products
Subscribe to feeds for updates on EIA products including Today in Energy and What's New.
Short, timely articles with graphics on energy, facts, issues, and trends.
Lesson plans, science fair experiments, field trips, teacher guide, and career corner.
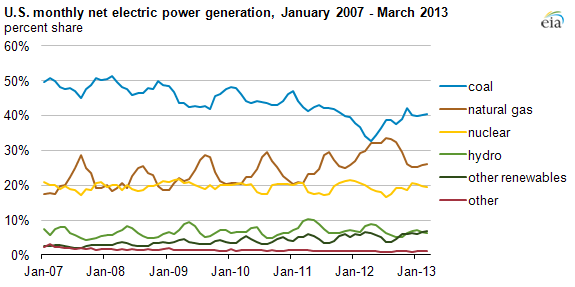
After an equal share of electric power was generated from coal and natural gas in April 2012, EIA's most recent preliminary data through March 2013 show coal has generated 40% or more of the nation's electricity each month since November 2012, with natural gas fueling about 25% of generation during the same period.
Since May 2012, a combination of higher prices for natural gas and increased demand for electricity during the summer months led electric systems across much of the country to increase their use of coal-fired units. In March 2013, coal-fired units generated a little over 130,000 megawatthours of electricity, while natural gas units produced nearly 85,000 megawatthours.
Heading into the 2013 spring shoulder season (between winter and summer), when demand for electricity typically falls, higher prices for natural gas reduced the fuel's share of total generation below the record levels of last April.
Nonetheless, the coal share of total generation remained well below its typical range prior to 2009. Between 2001 and 2008, the coal share (on an annual basis) ranged from 48% to 51%. Coal last achieved a 50% share in 2005 and is expected to be 40% in 2013, according to the most recent Short-Term Energy Outlook.
Recent statistics on electricity generation and the consumption, prices, and quantity of fuels used to produce electricity through March 2013 were released in the Electric Power Monthly, and regional trends in the use of these resources were discussed in the Electricity Monthly Update.
Tags: coal, electricity, generation, natural gas, prices