EIA updates its U.S. energy consumption by source and sector chart
Note: Click for full 2018 version and 1950 version.
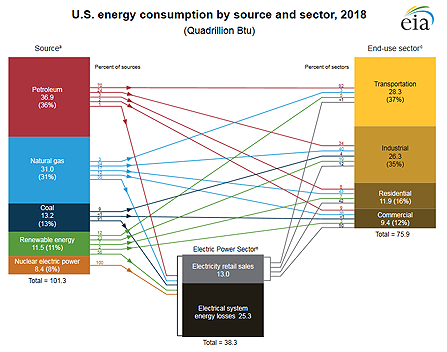
Energy consumption in the United States reached a record high of more than 101 quadrillion British thermal units (quads) in 2018, barely surpassing the previous high recorded in 2007 by less than 0.3%. The U.S. Energy Information Administration (EIA) has redesigned its U.S. energy consumption by source and sector chart to separate the electric power sector from the four end-use sectors. The new chart shows electricity retail sales to each end-use sector and the amount of electrical system energy losses within the electric power sector from generation, transmission, and distribution of electricity.
Since 1950, the electric power sector—which both consumes and produces energy—has been responsible for some of the largest changes in U.S. energy consumption. In 2018, the electric power sector consumed 38 quads of energy and provided 13 quads of electricity retail sales to the residential, commercial, industrial, and transportation sectors.
Nearly two-thirds of the energy that the power sector consumes (25 quads in 2018) is lost before it reaches end users. Most of these losses occur at steam-electric power plants (conventional and nuclear) when heat energy is converted into mechanical energy to turn electric generators. Other losses include the electricity used to operate power plants and the electricity lost in the transmission and distribution of electricity to end users.
Using primary energy sources results in other types of energy losses as a result of end-user consumption, such as gasoline burned to move vehicles or natural gas used to heat homes, and as a result of the transformation of one form of energy to another, such as refining crude oil into petroleum products. However, EIA does not separately collect this information. The Lawrence Livermore National Laboratory publishes estimates of primary energy losses by end-use sector, based on data in EIA’s Monthly Energy Review.
Note: Electric power sector data include electrical system energy losses.
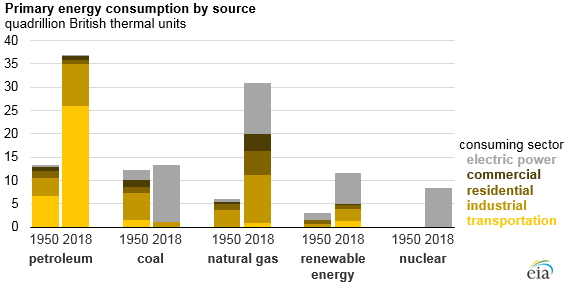
Petroleum products, such as motor gasoline, distillate fuel oil, and hydrocarbon gas liquids, have remained the largest sources of primary energy consumed in the United States since 1950. Most petroleum is consumed for transportation (70% in 2018). Petroleum shares to all other sectors have decreased since 1950.
Natural gas is the second-largest source of energy consumed in the United States. Natural gas consumption has increased substantially since the mid-2000s, mostly as a result of increases in natural gas-fired electricity generation. In 1950, the industrial sector consumed the most natural gas (59%) in the United States, and the electric power sector consumed only 11%. In 2018, the U.S. electric power sector consumed more natural gas (35%) than the industrial sector (34%).
Coal consumption in the United States decreased for the fifth consecutive year in 2018, reaching 13.2 quads, the lowest level since 1975 and about half of its peak in 2005. In 1950, nearly half of U.S. coal consumption was in the industrial sector (47%), and the transportation sector also consumed a significant share (13%). However, since the 1960s, nearly all U.S. coal has been used to generate electricity. In 2018, the electric power sector accounted for 91% of U.S. coal consumption.
Renewable energy consumption in the United States has nearly tripled since 1950, reaching a record 11.5 quads in 2018. The types of U.S. renewable fuels have diversified since 1950 from wood and hydroelectric power to wind, biofuels, solar, biomass waste, and geothermal energy. In 2018, the U.S. electric power sector consumed 56% of renewable energy.
First recorded in 1957, nuclear energy consumption increased to a record 8.4 quads in the United States in 2018. Only the electric power sector consumes U.S. nuclear energy, and net electricity generation from nuclear power plants has remained relatively flat since the mid-2000s.
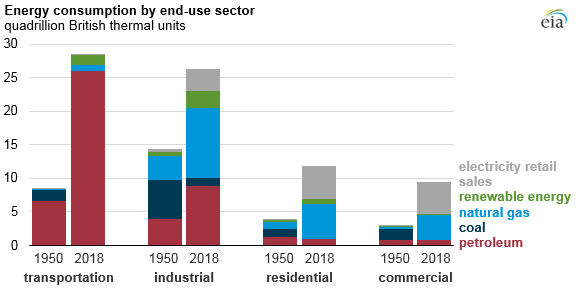
The transportation sector accounted for 28.3 quads of energy consumption in 2018 and has been the largest end-use consuming sector in the United States since 2000, when it surpassed the industrial sector. Most of the energy used for transportation comes from petroleum, but transportation fuels now include renewable biofuels such as ethanol and biodiesel.
The industrial sector is the second-largest end-use sector in the United States, accounting for 26.3 quads in 2018. In 1950, the U.S. industrial sector consumed more coal than any other fuel (40%), but in 2018, coal accounted for just 4% of industrial use. Natural gas is now the most-used fuel in the U.S. industrial sector, accounting for 40% of the industrial total.
The U.S. residential and commercial sectors consumed 11.9 quads and 9.4 quads, respectively, in 2018, and they have been the third- and fourth-largest end-use sectors since 1950. In 1950, nearly equal amounts of U.S. residential energy came from petroleum, coal, natural gas, and wood, and relatively little came from electricity (5%). In 2018, the U.S. residential sector consumed natural gas (43%) and electricity (42%) in nearly equal shares. Similarly, the U.S. commercial sector’s 2018 energy consumption was also mostly natural gas (38%) and electricity (50%).
Note: End-use sector data exclude electrical system energy losses and differ from the Monthly Energy Review Table 2.1, which allocates electrical system energy losses to the end-use sectors.
Principal contributor: Mickey Francis