Electricity Monthly Update
With Data for May 2026
Release Date:
July 23, 2026
Next Release Date:
August 26, 2026
Highlights: May 2026
-
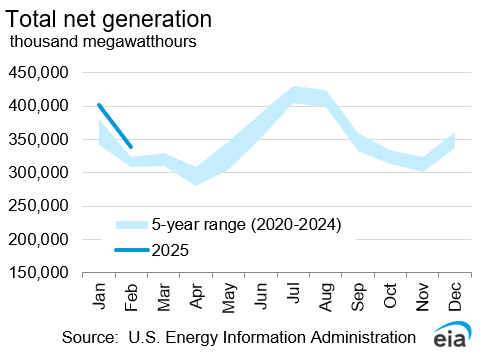
Net electricity generation in the United States increased 3.1% compared to May 2025.
-
Total U.S. coal stockpiles increased by 2.9% to 120 million tons compared to the previous month.
-
Texas (ERCOT) saw its daily peak electricity demand reach near the upper end of its twelve-month range as summer heat began building in the region during May 2026.
Key indicators