Electricity Monthly Update
Electricity Monthly Update Explained
Highlights
The Highlights page features in the center a short article about a major event or an informative topic. The left column contains bulleted highlights at the top and key indicators in a table and graphics - data you might be interested in at a glance. The right column is used for navigation.
End-Use: Retail Rates/Prices and Consumption
The second section presents statistics on end-use: retail rates/prices and consumption of electricity. End-use data is the first "data page" based on the assumption that information about retail electricity service is of greatest interest to a general audience.
The term rates/prices is used because charges for retail service are based primarily on set rates approved by State regulators. However, a number of states have allowed retail marketers to compete to serve customers and these competitive retail suppliers offer electricity at a market-based price.
Retail rates and prices are not collected by EIA. EIA does collect retail sales volumes and revenues which we use to calculate an average retail revenues per MWh as a proxy for retail rates and prices. Electricity consumption is reported as retail sales volumes.
Retail service data is presented on a monthly basis, it is important to understand that this information is reported by utilities based on their billing cycles. That is, sales and revenues are reported when the customer pays rather than when they use the electricity. These billing cycles do not necessarily coincide with the beginning and the end of months. For example, retail revenue and sales data reported in July reflects data for billing cycles that end sometime during July. Therefore, July data likely contains data from days toward the end of June and do not contain data from days toward the end of July.
Resource-Use: Supply and Fuel Consumption
The third section presents statistics on resource-use: supply and fuel consumption. These data follow end-use because the use of electricity involves the running of electric generators of various types and the burning of various fuels as part of the production process.
Unlike end-use data, monthly resource use data are reported for the month in which the electric is generated and fuel is consumed. This makes it easier to look at trends in resource-use data in the context of monthly weather and market data.
Electricity Regions
Since there are significant differences in supply mix and fuel use among different parts of the U.S., resource-use data is presented on a regional instead of a national basis. These data are presented for seven regions. The regions are: West (the U.S. portion of WECC), Texas (ERCOT), Southeast (most of SERC), Florida (FRCC), Central (Midwest ISO and Southwest Power Pool), Mid-Atlantic (PJM), and Northeast (New York ISO and ISO New England).
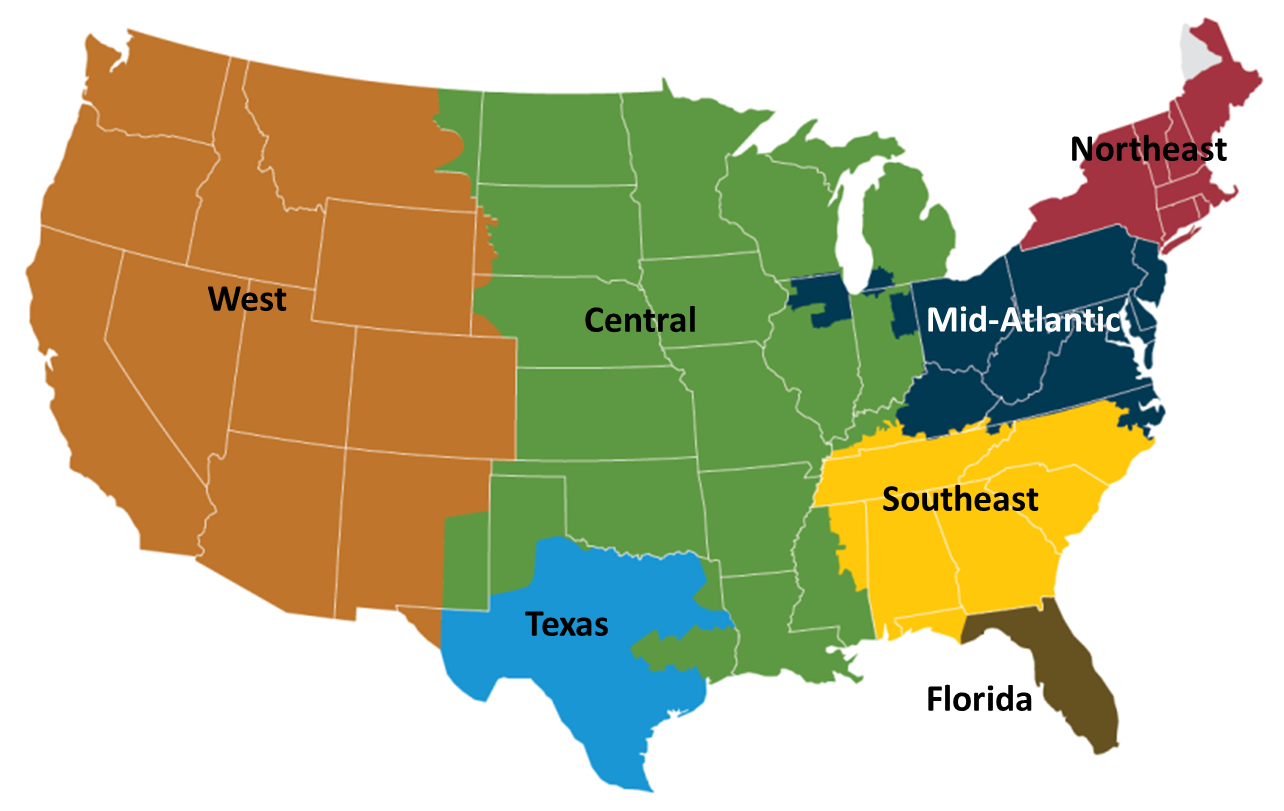
For the most part, these regions include contiguous electric systems with similar mixes for generator types and fuel use. In the west, the mix of resource-use in the northwest, California and the southwest subregions are very different. However, due to very active intra-regional trading and flows, it is reasonable to present resource-use data for the west as a whole.
Regional Wholesale Markets
The fourth section presents data on the market making systems in the electric power sector: wholesale markets. It is not possible to show meaningful national electricity market data. This is because the U.S. has many regional electricity markets. We present monthly and annual ranges of wholesale electricity prices at 10 selected regional pricing locations and monthly and annual ranges of daily peak system demand for 10 selected regional electric systems in the U.S.
Electric Power Sector Coal Stocks
Data on coal stocks and days of burn are presented in fifth section. The level of coal stockpiles becomes important for reliability concerns from time-to-time, especially when significant disruptions in fuel transportation routes occur. Statistics on both total coal stockpiles by coal-type as well as the average days of burn for non-lignite coal are presented and major developments are briefly noted.