
Electricity Monthly Update
Regional Wholesale Markets: July 2026
The United States has many regional wholesale electricity markets. Below we look at monthly and annual ranges of on-peak, daily wholesale prices at selected pricing locations and daily peak demand for selected electricity systems in the Nation. The range of daily prices and demand data is shown for the report month and for the year ending with the report month.
Prices and demand are shown for six Regional Transmission Operator (RTO) markets: ISO New England (ISO-NE), New York ISO (NYISO), PJM Interconnection (PJM), Midwest ISO (MISO), Electric Reliability Council of Texas (ERCOT), and two locations in the California ISO (CAISO). Also shown are wholesale prices at trading hubs in Louisiana (into Entergy), Southwest (Palo Verde) and Northwest (Mid-Columbia). In addition to the RTO systems, peak demand is also shown for the Southern Company, Progress Florida, and the Bonneville Power Authority (BPA). Refer to the map tabs for the locations of the electricity and natural gas pricing hubs and the electric systems for which peak demand ranges are shown.
In the second tab immediately below, we show monthly and annual ranges of on-peak, daily wholesale natural gas prices at selected pricing locations in the United States. The range of daily natural gas prices is shown for the same month and year as the electricity price range chart. Wholesale electricity prices are closely tied to wholesale natural gas prices in all but the center of the country. Therefore, one can often explain current wholesale electricity prices by looking at what is happening with natural gas prices.
Wholesale prices
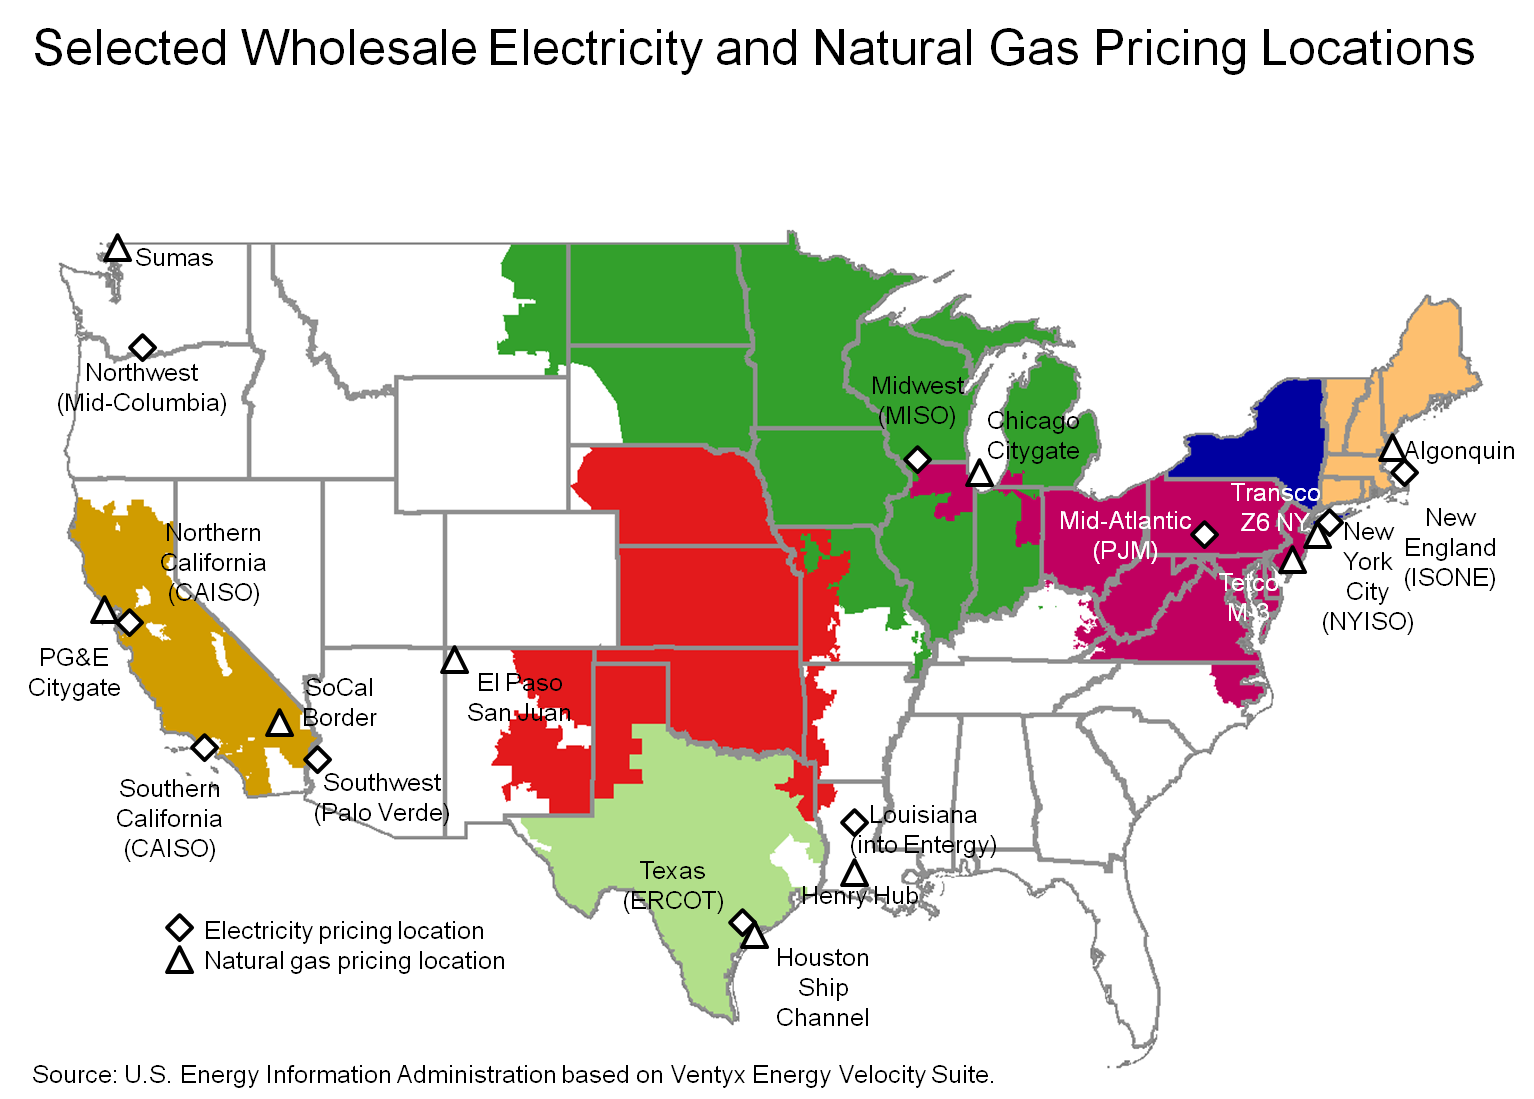
Wholesale electricity prices at most regional trading hubs saw wide monthly ranges in July 2026, with prices moving between the lower end of their annual ranges to mid-range levels during the month. Louisiana (into Entergy) was an exception, with prices remaining near, but not quite reaching, the lower end of their twelve-month range and seeing a relatively narrow monthly spread compared to other trading hubs. The Mid-Atlantic (PJM) and New England (ISONE) markets saw the widest monthly price swings, with PJM prices ranging from around $42/MWh to $479/MWh and New England prices ranging from around $43/MWh to $420/MWh during July 2026. The Midwest (MISO) and New York City (NYISO) also saw wide monthly price ranges during the month.
Wholesale natural gas prices were near the lower end of their annual ranges across most markets in July 2026, with the majority of hubs trading in fairly tight ranges. Northern CA (PG&E Citygate) prices reached their lowest level of the twelve-month period during the month. New England (Algonquin) had the widest monthly price range of any market, with prices ranging from around $2.01/MMBtu to $4.73/MMBtu during July 2026. The Southern CA (SoCal Border) and Southwest (El Paso San Juan) markets also saw relatively wider price ranges compared to other hubs, while markets from Texas through the Midwest traded in tight ranges near their annual lows.
Electricity system daily peak demand
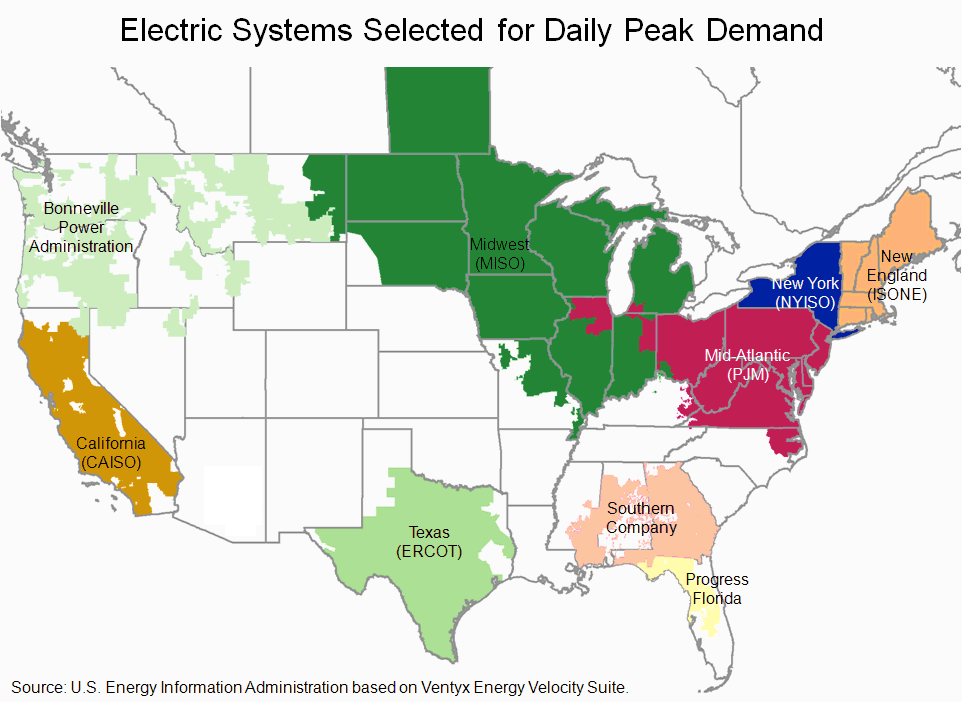
All parts of the country saw their electricity system daily peak demand reach the upper end of their twelve-month ranges during July 2026. Texas (ERCOT) set a new all-time peak demand record of 91.1 GW on July 22nd, driven by a heat wave experienced across the region. New England (ISONE), New York State (NYISO), and the Mid-Atlantic (PJM) reached the top of their twelve-month ranges early in the month. The Midwest (MISO), Southern Company, Progress Florida, California (CAISO), and Bonneville Power Administration (BPAT) did not reach the top of their twelve month ranges, but each approached the upper end of their twelve-month ranges during July.