 2018 CBECS: Principal Building Activities
Food Service
Food service buildings are used for selling prepared food and beverages.
We publish three subcategories of food service buildings:
- Restaurant or cafeteria
- Fast food
- Other food service, which includes buildings such as bars, pubs, lounges, coffee shops, donut shops, ice cream shops, and catering services
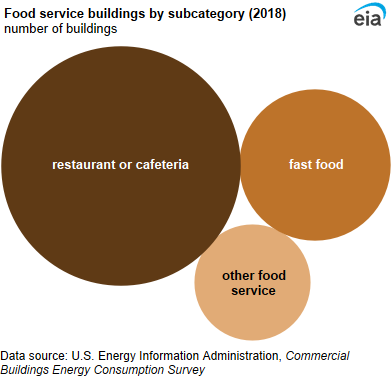
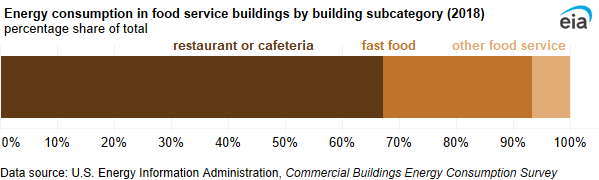
The most common food service building type was restaurants and cafeterias, accounting for 61% of all food service buildings. Fast food restaurants made up about one-fourth (24%) of all food service buildings.
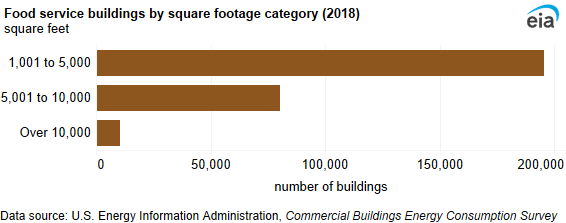
Two-thirds of food service buildings were between 1,001 square feet and 5,000 square feet. On average, food service buildings were the smallest commercial building type in terms of square feet, averaging 4,800 square feet per building.
Energy use in food service buildings
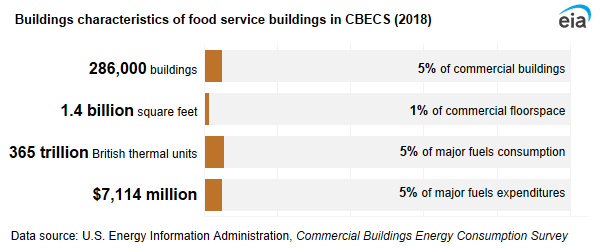
Food service buildings used 365 trillion British thermal units (TBtu) of energy in 2018, averaging 263.3 thousand British thermal units (MBtu) per square foot. Although food service buildings accounted for 1% of total commercial floorspace, these buildings accounted for over 5% of energy consumption in commercial buildings. Electricity was the most-used fuel (207 TBtu), followed by natural gas (151 TBtu).
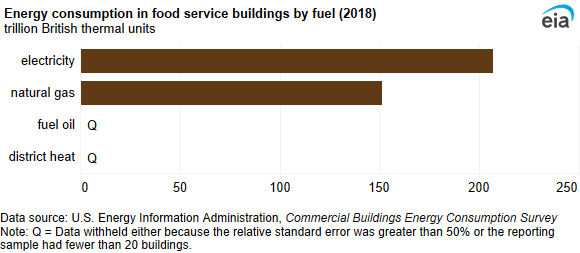
Food service buildings were among the most energy-intensive commercial building types, using 263 MBtu per square foot. On average, commercial buildings used 70 MBtu per square foot. Also, food service buildings had the highest natural gas intensity (147.6 cubic feet per square foot), which was over four times higher than the natural gas intensity for all commercial buildings (32.7 cubic feet per square foot).
Approximately two-thirds of food service energy consumption came from restaurants and cafeterias (245 TBtu).
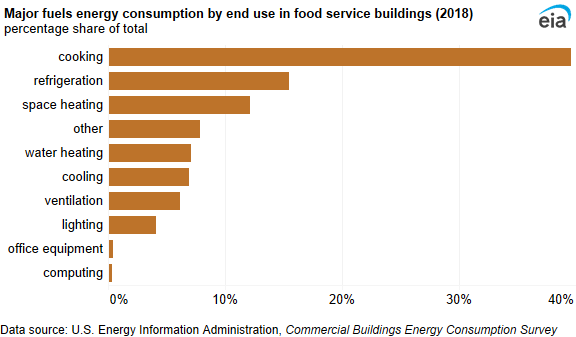
When considering all building types, food service buildings had the largest share of end-use consumption dedicated to cooking (40%). Refrigeration accounted for the second-largest share (15%) of end-use consumption, followed by space heating (12%). All other end uses each accounted for 7% or less of end-use consumption.
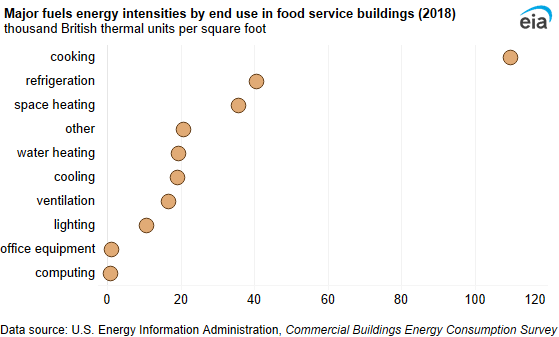
Energy intensity was highest for cooking (109.7 MBtu per square foot), which was almost three times higher than refrigeration, the second-highest energy intensity (40.6 MBtu per square foot). Food service buildings also had the highest cooling energy intensity (19.1 MBtu per square foot).
Inside food service buildings
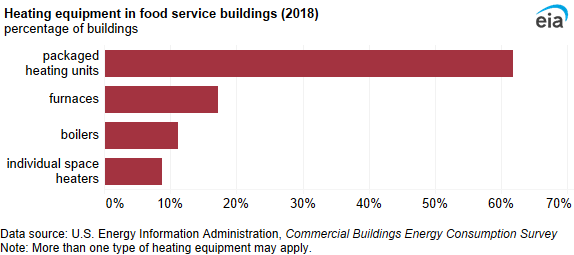
Packaged heating units were the most common heating equipment in food service buildings. They were used in 62% of food service buildings, about three times more often than furnaces, the second-most-used heating equipment (17%).
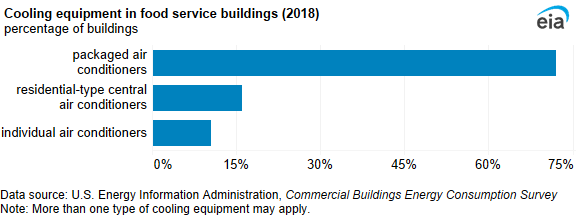
Almost three-fourths of food service buildings (72%) used packaged air conditioners. The second-most-used cooling equipment in food service buildings was residential-type central air conditioners (16%).
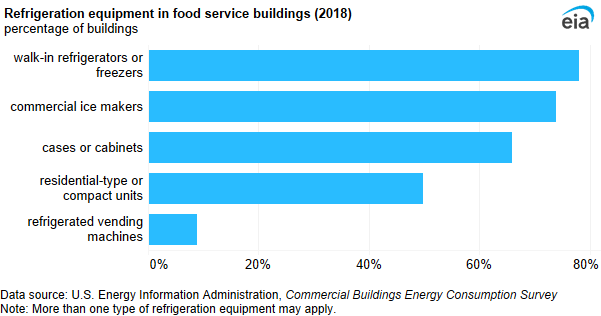
Two-thirds or more of food service buildings had walk-in refrigerators or freezers (78%), commercial ice makers (74%), or refrigerated cases or cabinets (66%). One-half of food service buildings had residential or compact refrigeration units.
We asked food service building occupants if they used booster water heaters, which are used to increase water temperature by up to 195°F, often for sanitizing. About 29% of food service buildings used booster water heaters. In 2018, 36% of restaurants or cafeterias and 25% of fast food buildings used booster water heaters. We also asked about any activities that required large amounts of hot water, such as commercial dishwashers. Half of food service buildings used large amounts of hot water. Restaurants or cafeterias accounted for 78% of food service buildings that required large amounts of hot water.


