Virtual Listing in the 2018 CBECS
Release date: June 20, 2019
For the first time in its nearly 40 year history, the Commercial Buildings Energy Consumption Survey (CBECS) used a method other than field listing to construct most of its frame, which is the list of buildings the sample is selected from. The 2018 CBECS used a new method called virtual listing in addition to the former method called field listing. For more information on the sample design and frame construction, see How were buildings selected for the 2018 CBECS?
Field listing was used to create CBECS sampling frames before 2018
Before the 2018 CBECS, the CBECS area frame was created with field listing: trained staff traveled to statistically-sampled geographic areas and walked (or drove in suburban and rural areas) every street within the area boundaries, recording information about every commercial building. The collected information (including data such as the address, building name, size, and use category) was used to select the sample and to help CBECS interviewers locate the building.
Although this method of frame construction has proven successful, it is expensive and time-consuming. With the rapid availability and improvement of maps, satellite imagery, and panoramic views of streets (such as Google Street View™), EIA began to explore the possibility of virtually listing buildings using from online sources instead of using field listing.
Research projects in 2013 and 2017 examined the feasibility of virtual listing for CBECS
In 2013, EIA conducted research to assess the feasibility of listing commercial buildings using Google Earth™. The results (Lewis 2013) showed that 80% of a random sample of 400 of the buildings that were field listed in the fall of 2012 for use in the 2012 CBECS frame could be located on Google Earth. The building size was able to estimated in 98% of the located buildings, and the building use was able to be estimated in 86% of the located buildings. EIA concluded that, at the time the research was conducted, using Google Earth to construct a frame could lead to undercoverage of the CBECS eligible population and, therefore, should not completely replace traditional field listing. However, further research was needed because the results had shown promise in some areas.
In 2017, four years after the initial research project was conducted, Westat (EIA’s contractor for the 2018 CBECS) reevaluated using Google Earth in the frame development for CBECS. They found significant improvements in the quality, coverage, and timeliness of satellite imagery and Street View images. With the addition of geographic layers built with commercial data sources, EIA and Westat agreed that the technology was likely ready to replace field listing.
Virtual Listing System was built to list buildings for the CBECS frame
Westat developed a Virtual Listing System (VLS) to list buildings for the CBECS frame. The VLS is a fully integrated, custom, web-based system for observing, cataloging, and documenting CBECS-eligible commercial buildings [1]. The VLS transports the lister virtually to their assigned segment and enables the lister to canvass their segment remotely, using Google’s 2-D and 3-D aerial satellite view. The VLS also provides panoramic street images from Google Street View. The system includes custom geographic layers that are used as a reference for identifying buildings.
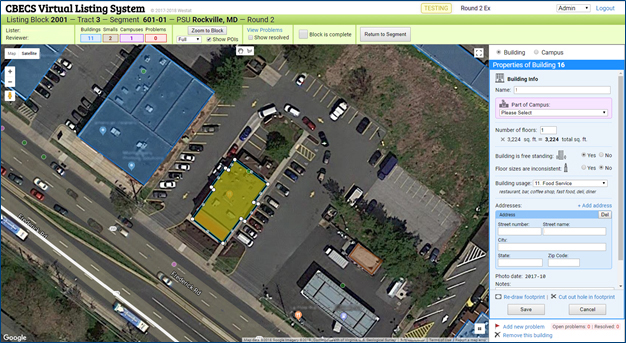
Once a building is identified as being eligible for CBECS, the lister identifies the building by tracing the outline of the building’s roof with their mouse to create an enclosed polygon. The building’s outline, or footprint, is stored in the VLS with other relevant building characteristics. Figure 1 is a screenshot of the VLS [2] where the lister added a footprint to the building in the center of the screen (yellow polygon) and added the relevant building characteristics in the property panel on the right. The VLS automatically estimates the building’s square footage once the number of floors is entered. After the lister saves the entered and calculated data, the building footprint turns blue, and the building geography and attributes are stored in the VLS. The lister follows the same procedure for every eligible commercial building within the segment boundaries.
In test, VLS identified more buildings than field listing and was less expensive
Before using the VLS for constructing the 2018 CBECS frame, a large-scale test of the VLS was conducted to check its suitability for field listing replacement. A sample of 59 segments from a total of 764 [3] in the 2018 CBECS multi-stage area probability design was selected to compare the two listing methods. When these 59 segments were listed in the field and in the VLS, the listings were matched to see which buildings were listed in both methods, which buildings were listed in the field only, and which buildings were listed in the VLS only.
Table 1 shows three primary outcomes after matching the buildings from the two methods: buildings identified in VLS but missed in the field listing, buildings identified in the field listing but missed in VLS, and buildings found in both. The table shows the number and share of buildings with each outcome, both overall and by building size. Overall, 69.0% of the total listed buildings were found in both methods, 19.8% were found in the virtual method and not identified by the field listing method, and 11.2% were found in the field method and not identified by the virtual method. For both listing methods, the highest percentage of missed buildings was in the smallest size category, 501–10,000 square feet. Because energy usage is highly correlated with building size, the coverage of larger buildings is of much greater concern than that of smaller buildings.
| Building size (square feet) |
Total buildings listed |
Listed with both methods | Listed in VLS, not found in field | Listed in field, not found in VLS | |||
|---|---|---|---|---|---|---|---|
| Number | Percent | Number | Percent | Number | Percent | ||
| 501–10,000 | 16,866 | 10,817 | 64.1% | 3,855 | 22.9% | 2,194 | 13.0% |
| 10,001–25,000 | 2,947 | 2,423 | 82.2% | 343 | 11.6% | 181 | 6.1% |
| 25,001–50,000 | 1,131 | 967 | 85.5% | 104 | 9.2% | 60 | 5.3% |
| 50,001–100,000 | 683 | 611 | 89.5% | 39 | 5.7% | 33 | 4.8% |
| 100,001–200,000 | 345 | 311 | 90.1% | 25 | 7.3% | 9 | 2.6% |
| 200,001 + | 193 | 165 | 85.5% | 16 | 8.3% | 12 | 6.2% |
| Total | 22,165 | 15,294 | 69.0% | 4,382 | 19.8% | 2,489 | 11.2% |
Table 2 below shows the results for the four building-use categories that are used for sampling. [4] In each of the four categories, a higher percentage of buildings was found by the VLS method only, compared with the percentage found only with the field listing method. Warehouse and vacant buildings are most likely to be missed by both methods, with almost 30% missed by the field listing method.
| Building use | Total buildings listed |
Listed with both methods | Listed in VLS, not found in field | Listed in field, not found in VLS | |||
|---|---|---|---|---|---|---|---|
| Number | Percent | Number | Percent | Number | Percent | ||
| 1 - Public assembly, office, sales, mercantile, service | 12,176 | 8,854 | 72.7% | 2,043 | 16.8% | 1,279 | 10.5% |
| 2 - Education, lodging, public order | 3,604 | 2,387 | 66.2% | 932 | 25.9% | 285 | 7.9% |
| 3 - Food service, health care, laboratory, other | 2,325 | 1,997 | 85.9% | 210 | 9.0% | 118 | 5.1% |
| 4 - Warehouse, vacant | 4,060 | 2,056 | 50.6% | 1,197 | 29.5% | 807 | 19.9% |
| Total | 22,165 | 15,294 | 69.0% | 4,382 | 19.8% | 2,489 | 11.2% |
The results of the 59 segment test show that the VLS missed a smaller percentage of buildings in every size and use category compared with the field listing. These findings suggest that replacing the field listing method with VLS (in those segments for which it is feasible) would improve coverage of buildings for the CBECS frame.
In addition to covering more buildings than the field listing method, the virtual listing was substantially less expensive. Both the field and virtual staff listed the 59 segments during the same period, however the hours worked and production were quite different. Virtual listers completed the segments in less than half the hours of the field listers. The virtual staff was able to list buildings with the VLS much faster, averaging 6.3 minutes per building, while the field staff averaged 15.3 minutes per building. Field listing travel costs included flights, hotel stays, per diem, and car rentals for the two-month field period. The virtual listing had no travel expenses.
Most of the 2018 CBECS frame was constructed with VLS
The 59 segment test showed that the VLS could be used instead of field listing for constructing most of the CBECS frame, with improvements in both coverage and cost over field listing. More than 224,500 buildings in the remaining CBECS segments were virtually listed in the summer and fall of 2018 by a team specially trained on the CBECS and the VLS. The sample of buildings for the 2018 CBECS was selected from the combined frame of buildings, which includes VLS listed buildings, field listed buildings, and large buildings from administrative lists. About 16,000 buildings were selected for the sample; EIA estimates that about 8,000 of those buildings will be eligible for CBECS and will respond to the survey.
Data collection for the sampled buildings began in April 2019.
Footnotes
1. To be eligible for the CBECS, a building must be larger than 1,000 square feet and 50 percent or more of the space must be used for activities that are not residential, agricultural, or manufacturing/industrial.
2. This image is from a test segment, not an actual CBECS segment.
3. All 764 segments were checked for virtual-listing suitability by examining the availability and quality of aerial and Google Street View images. A small number (26) of segments were deemed unfit for virtual listing, so they were excluded from the pool of potential segments to be sampled for the 59 segment test. These 26 segments were field listed.
4. A much larger list of building use categories is used in data collection and reporting.
References
Giangrande, M., Brick, J., Morganstein, D. and Lewis, K. (2018). “Virtual Listing: GIS Approaches to Improve Survey Listing Efficiency,” 2018 Joint Statistical Meetings (JSM), Vancouver, British Columbia, Canada. July 28 - August 2, 2018
Lewis, Katie, “Exploratory Research on the Use of Google Earth to Create a Sampling Frame of Buildings,” 2013 Federal Committee on Statistical Methodology (FCSM) Research Conference, Washington D.C. November 4-6, 2013.
Contact Joelle Michaels if you have questions or would like more detailed information.


