Maps
These maps illustrate geographic areas used in the Commercial Buildings Energy Consumption Survey (CBECS).
- U.S. census regions and divisions
- U.S. climate zones for 2018 CBECS
- Building America climate regions (2012 CBECS)
- U.S. climate zones for 2003 CBECS
- U.S. climate zones for 1979-1999 CBECS
- Definitions of CBECS climate zones
U.S. census regions and divisions:
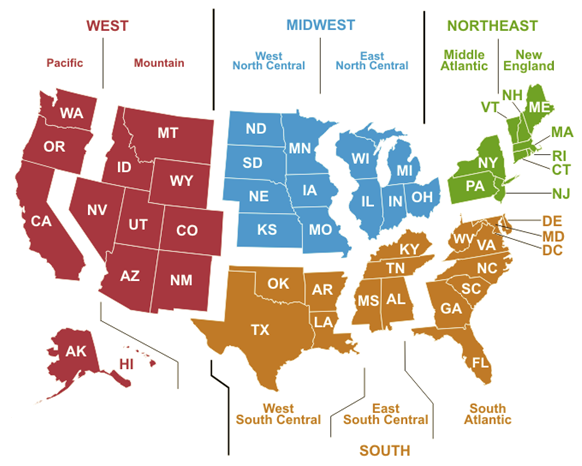
Data source: U.S. Census Bureau
U.S. climate zones for 2018 CBECS:
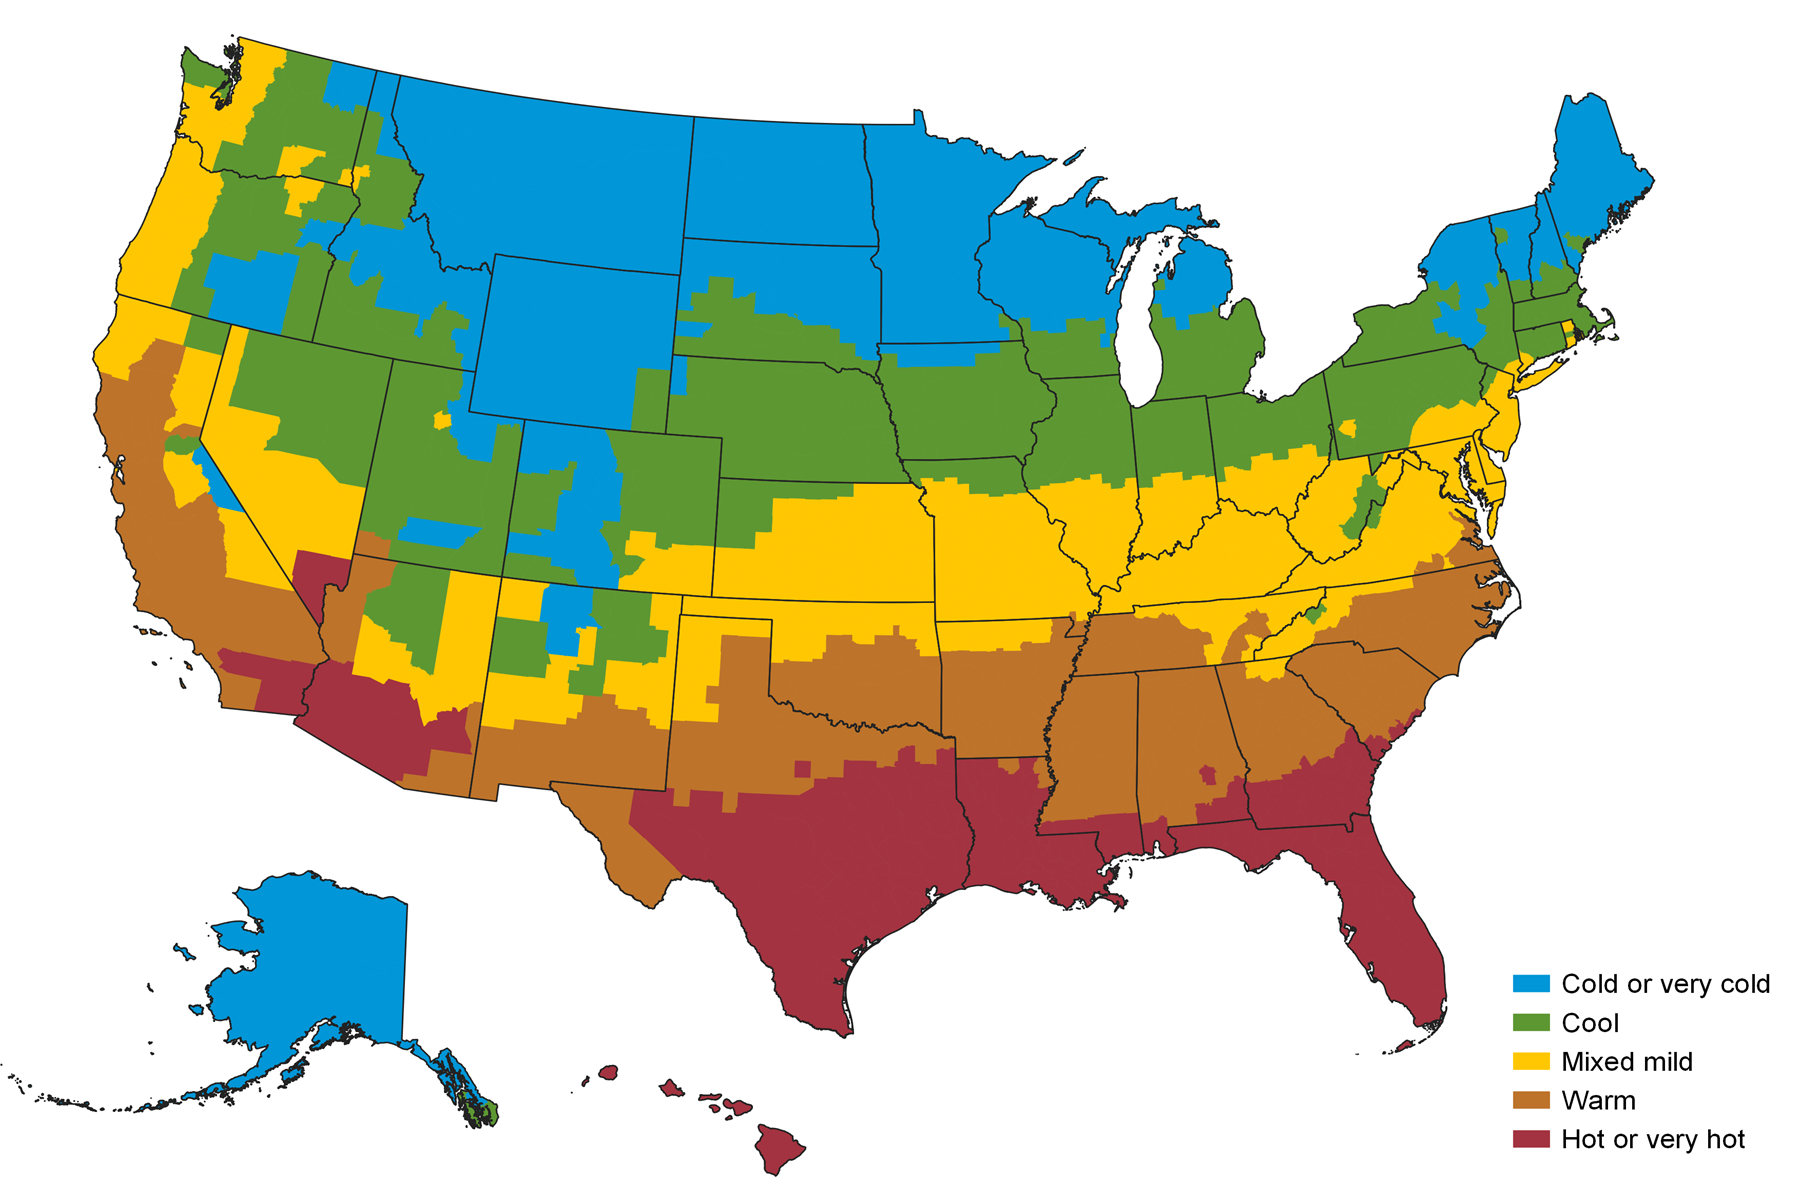
Data source: ANSI/ASHRAE Standard 169-2021, Climatic Data for Building Design Standards
Note: Adapted with permission from Figure A‐2, Climate zones for United States counties, ANSI/ASHRAE
Standard 169-2021, Climatic Data for Building Design Standards, © 2021 ASHRAE.
Building America climate regions (2012 CBECS):

Data source: U.S. Department of Energy, Building America program
U.S. climate zones for 2003 CBECS:

Data source: National Oceanic and Atmospheric Administration
U.S. climate zones for 1979-1999 CBECS:

Data source: National Oceanic and Atmospheric Administration
Definitions of CBECS climate zones
2018 CBECS
The 2018 CBECS climate zones are based on groups of county-level American Society of Heating, Refrigerating and Air-Conditioning Engineers (ASHRAE) climate zones as designated in ANSI/ASHRAE Standard 169-2021, Climatic Data for Building Design Standards. ASHRAE labels climate zones with numbers and letters. Numbers reflect the thermal climate zone and are determined by annual average heating degree days and cooling degree days. Letters reflect marine, dry, or humid moisture zones and are determined by precipitation and temperatures. The period of record for weather data used in Standard 169-2021 was from 1994 to 2019.
| Climate zone for 2018 CBECS | U.S. climate zones for 2018 CBECS |
|---|---|
| Cold or very cold | 6A, 6B, 7, 8 |
| Cool | 5A, 5B, 5C |
| Mixed mild | 4A, 4B, 4C |
| Warm | 3A, 3B, 3C |
| Hot or very hot | 1A, 1B, 2A, 2B |
2012 CBECS:
The 2012 CBECS reported climate regions created by the Building America program, sponsored by the U.S. Department of Energy’s Office of Energy Efficiency and Renewable Energy (EERE). EERE’s Guide to Determining Climate Regions by County contains a list of all U.S. counties by climate region.
2003 CBECS:
The CBECS climate zones were groups of climate divisions, as defined by the National Oceanic and Atmospheric Administration (NOAA), which are regions within a state that are as climatically homogeneous as possible. Each NOAA climate division was placed into one of five CBECS climate zones based on its 30-year average heating degree days (HDD) and cooling degree days (CDD) for the period 1971 through 2000. (These climate zones were updated for the 2003 CBECS. All previous CBECS cycles used averages for the 45-year period from 1931 through 1975.)
An HDD is a measure of how cold a location was over a period of time, relative to a base temperature (in CBECS, 65°F). The heating degree day is the difference between that day's average temperature and 65°F if the daily average is less than 65°F; it is zero if the daily average temperature is greater than or equal to 65°F. For example, if the average temperature for a given day is 40°F, then the heating degree days for that single day equal 25. Heating degree days for a year are the sum of the daily heating degree days that year.
Similarly, a CDD is a measure of how hot a location was over a period of time, relative to a base temperature (65°F). The cooling degree day is the difference between that day's average temperature and 65°F if the daily average is greater than 65°F; it is zero if the daily average temperature is less than or equal to 65°F. For example, if the average temperature for a given day is 80°F, then the cooling degree days for that single day equal 15. Cooling degree days for a year are the sum of the daily cooling degree days for that year.
There are 359 NOAA climate divisions within the 50 U.S. states. Boundaries of these divisions generally coincide with county boundaries, except in the western United States, where they are based largely on drainage basins. A map of all the NOAA climate divisions in the United States is available online. Individual state maps that show the NOAA climate divisions by county are also available online.
Each building in CBECS was assigned a CBECS climate zone based on the 30-year average (1971–2000) HDD and CDD (base 65°F) for the NOAA climate division in which the weather station closest to the sampled building is located.
| Climate Zone | Cooling Degree Days | Heating Degree Days |
|---|---|---|
| 1 | Fewer than 2,000 | More than 7,000 |
| 2 | Fewer than 2,000 | 5,500 to 7,000 |
| 3 | Fewer than 2,000 | 4,000 to 5,499 |
| 4 | Fewer than 2,000 | Fewer than 4,000 |
| 5 | 2,000 or More | Fewer than 4,000 |
This Excel file provides the CBECS climate zone for each U.S. county. Usually, there is only one climate zone per county and the mapping is straightforward. However, in some of the Western states, the NOAA climate divisions (on which the CBECS climate zones are based) are defined more by drainage basins than by counties, and so sometimes there is more than one climate zone per county.