 2018 CBECS: Principal Building Activities
Food Sales
Food sales buildings are used for retail or wholesale of food. Grocery and other food sales stores located in strip shopping centers are reported in the mercantile category for principal building activities instead of food sales.
We publish three subcategories of food sales buildings:
- Convenience store (with or without a gas station)
- Grocery store or food market
- Other food sales, which includes bakeries
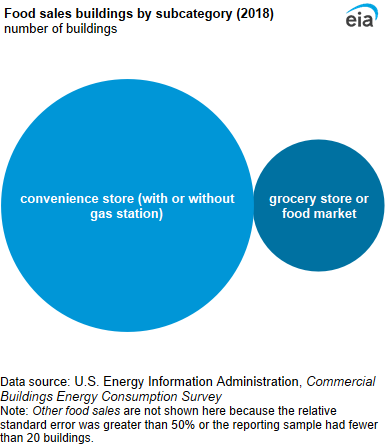
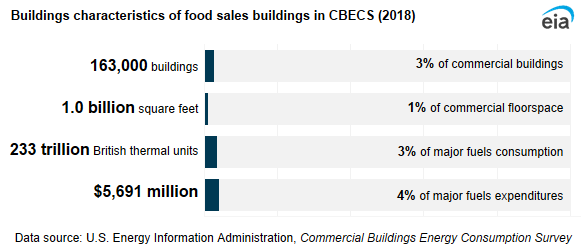
Convenience stores were the most common food sales buildings. Of the 163,000 food sales buildings, 74% were convenience stores. Although grocery stores and food markets made up a smaller percentage of food sales buildings, these buildings accounted for 60% of total food sales floorspace.
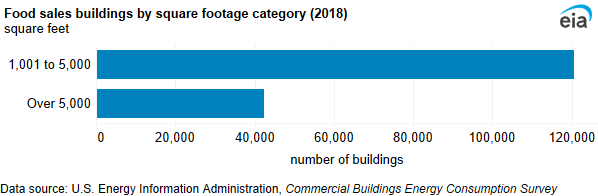
Given that the majority of food sales buildings were convenience stores, about three-fourths (74%) of food sales buildings were less than 5,000 square feet. In CBECS, strip shopping centers are reported as a separate building activity, and because many grocery stores are located in strip shopping centers, they aren’t reported in the food sales category. On average, food sales buildings were 6,200 square feet per building, and most (92%) of these buildings had only one floor.
Energy use in food sales buildings
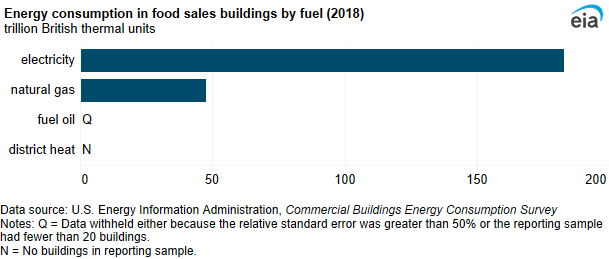
Food sales buildings used 233 trillion British thermal units (TBtu) of energy in 2018. Although food sales buildings accounted for 1% of total commercial floorspace, these buildings accounted for 3% of energy consumption in commercial buildings. Electricity was the most-used fuel (183 TBtu), followed by natural gas (48 TBtu). Food sales buildings were one the most energy intensive building types, with a mean energy intensity of 232.0 thousand British thermal units (MBtu) per square foot. The electricity intensity for food sales buildings (53.3 kilowatthours [kWh] per square foot) was over four times higher than the electricity intensity for all commercial buildings (12.6 kWh per square foot).
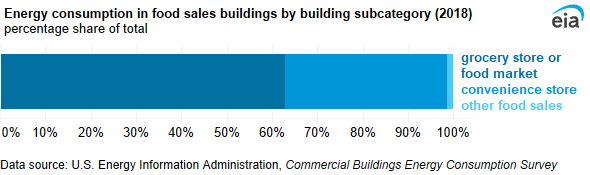
Although convenience stores accounted for a higher percentage of food sales buildings, grocery stores and food markets accounted for 63% of food sales energy consumption.
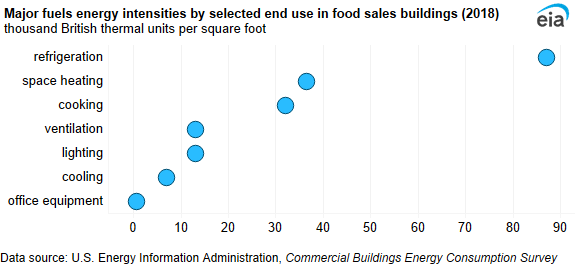
When considering all building types, food sales buildings had the largest share of end-use consumption dedicated to refrigeration (38%). Space heating accounted for the second-largest share (14%) of end-use consumption, followed by cooking (11%).
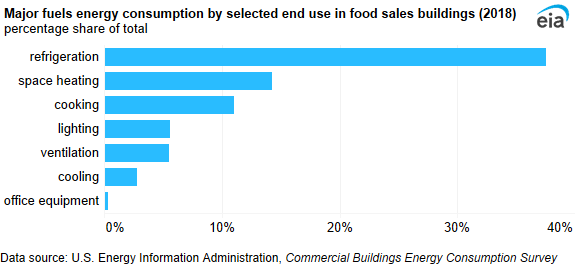
Energy intensity was highest for refrigeration (87.1 MBtu per square foot), and ventilation and lighting had similar intensities (each 13.1 MBtu per square foot).
Inside food sales buildings
Packaged heating units were the most common heating equipment in food sales buildings and were used in 44% of food sales buildings. More than one-half of food sales buildings (58%) used packaged air conditioners for cooling.
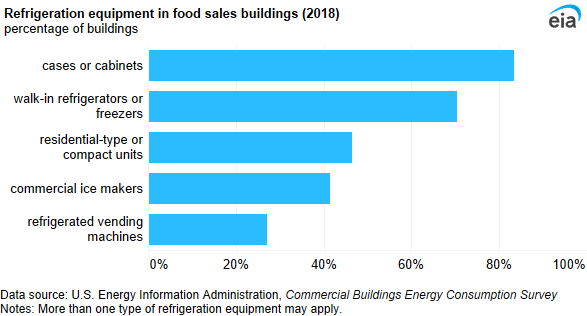
Refrigerated cases or cabinets (83%) and walk-in refrigerators or freezers (70%) were the most frequently used refrigeration equipment.
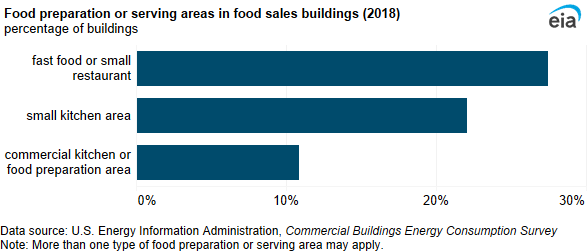
The most common food preparation or serving area was fast food or small restaurant, which was present in 27% of food sales buildings. The second-most common area was the small kitchen area, which was present in 22% of food sales buildings.
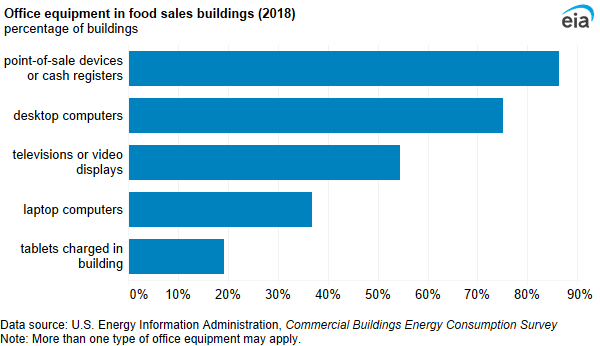
The majority of food sales buildings (86%) had at least one cash register or point-of-sale device. Desktop computers (75%) and televisions or video displays (55%) were used in more than one-half of all food sales buildings.