 2018 CBECS: Principal Building Activities
Education
Education buildings are used for academic or technical classroom instruction and can refer to elementary schools, middle schools, high schools, colleges, or universities, among other types of schools.
We publish seven subcategories of education buildings:
- College or university
- Elementary school
- Middle or junior high school
- High school
- Multigrade school
- Preschool or daycare
- Other classroom education, which includes buildings for career or vocational training and adult or religious education
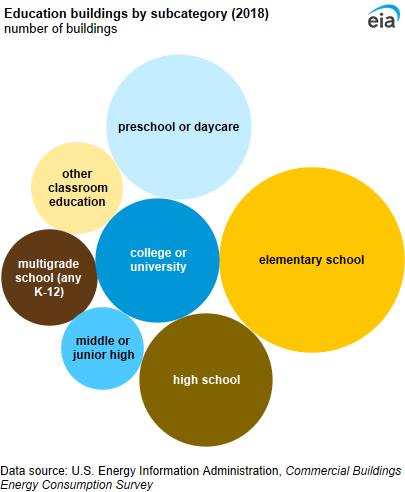
The most common education building type was elementary schools (30%). The second-most common education building type was preschools or daycare centers (19%). When considering total floorspace, elementary schools and high schools accounted for 52% of the total floorspace of education buildings. Although preschools or daycare centers were the second-most common education building, these buildings only accounted for 4% of the total floorspace of education buildings.
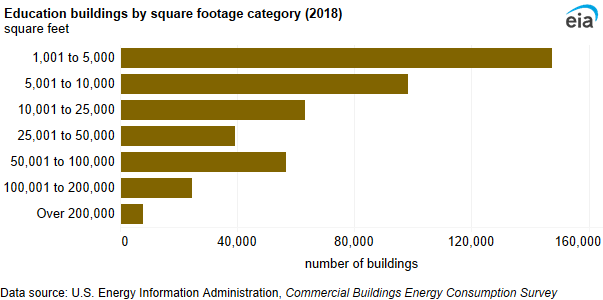
More than one-half (56%) of all education buildings were less than 10,000 square feet. On average, education buildings were 31,100 square feet per building.
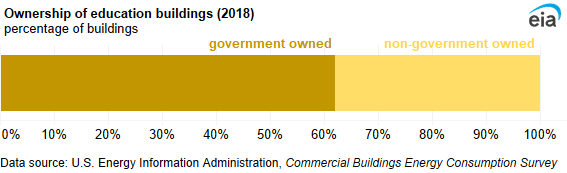
Education buildings were often located on a campus complex (61%). More than one-half (62%) of education buildings were government owned, and of these buildings, 62% were owned by local governments.
Energy use in education buildings
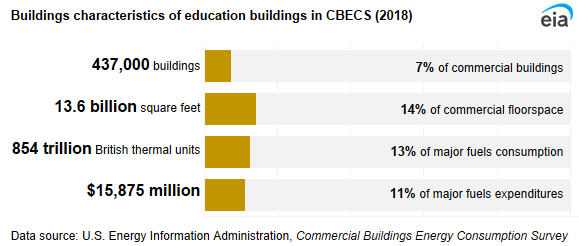
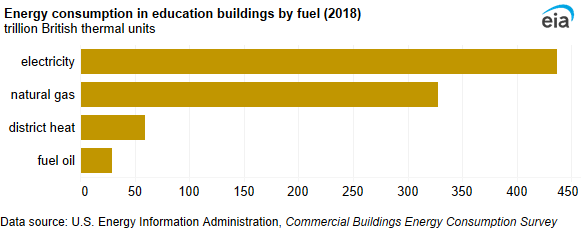
Education buildings used 854 trillion British thermal units (TBtu) of energy in 2018, which was 13% of total energy consumption in commercial buildings. Electricity was the most-used fuel (437 TBtu), followed by natural gas (328 TBtu). Education buildings used the most fuel oil, 29 TBtu, which was 29% of all fuel oil consumption. The mean energy intensity for education buildings was 62.7 thousand British thermal units (MBtu) per square foot.
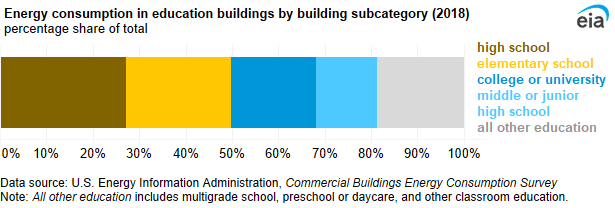
Approximately one-half of education energy consumption came from high schools (27%) and elementary schools (23%).
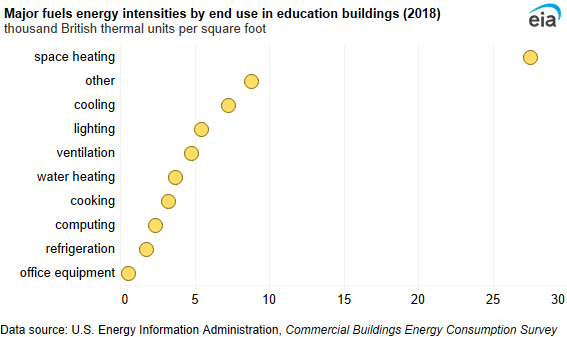
Space heating accounted for the largest share (42%) of end-use consumption, followed by other (14%) and cooling (11%) in education buildings. All other end uses each accounted for 10% or less of end-use consumption.
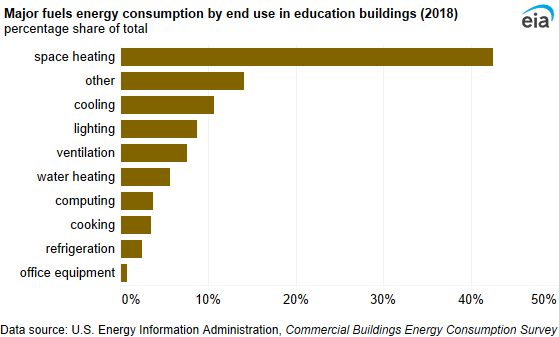
Energy intensity in education buildings was highest for space heating (27.6 MBtu per square foot) and lowest for office equipment (0.5 MBtu per square foot).
Inside education buildings
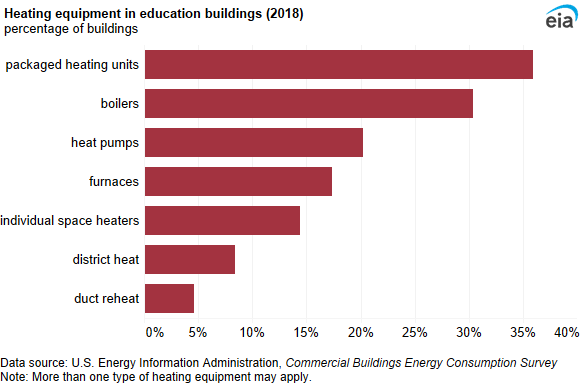
Packaged heating units were the most common heating equipment and were used in 36% of education buildings. Boilers were used in 30% of education buildings, and heat pumps were used in 20% of education buildings.
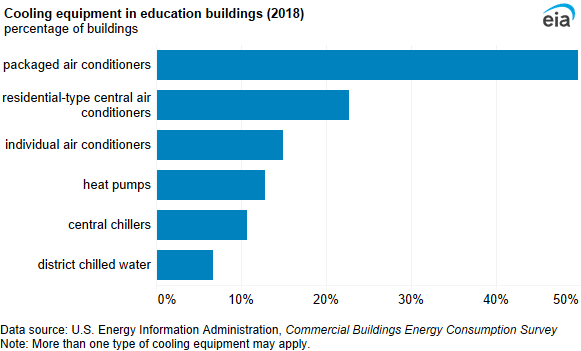
Packaged air conditioners cooled one-half of education buildings in 2018. The second-most-used cooling equipment was residential-type air conditioners (23%).
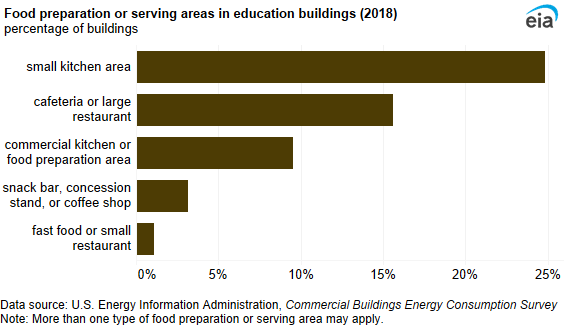
One-fourth of education buildings had small kitchen areas. Cafeterias or large restaurants were present in 16% of education buildings.
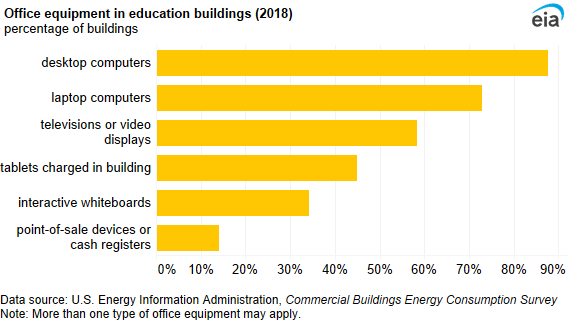
The majority of education buildings (88%) had desktops, and 73% had laptops. Almost one-half (45%) of education buildings had tablets that were charged in the building. About one-third (34%) of all education buildings had at least one interactive whiteboard.
We asked education building occupants if they had laboratory equipment that requires extra energy consumption. Some examples of laboratory equipment are fume hoods, gas chromatographs, centrifuges, spectrometers, and analysis equipment. Approximately 13% of education buildings used laboratory equipment.


