 2018 CBECS: Principal Building Activities
Health Care
Health care buildings are used as diagnostic and treatment facilities for both inpatient and outpatient care. Medical offices are included here if they use any type of diagnostic medical equipment (if they do not, they are categorized as an office building). Skilled nursing or other residential care buildings are categorized as lodging.
We publish three subcategories of health care buildings:
- Inpatient health, which includes inpatient hospitals and rehabilitation centers
- Medical office (diagnostic)
- Clinic or other outpatient care, which includes outpatient rehabilitation and veterinary offices
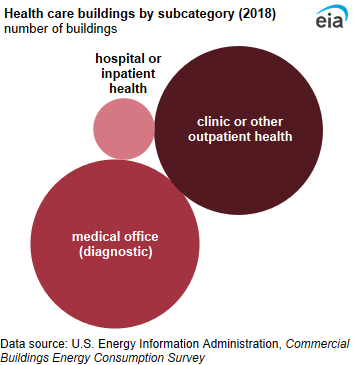
Medical offices and clinic or other outpatient health buildings accounted for the same percentage of health care buildings (47% each). Hospitals and other inpatient health buildings accounted for only 6% of health care buildings.
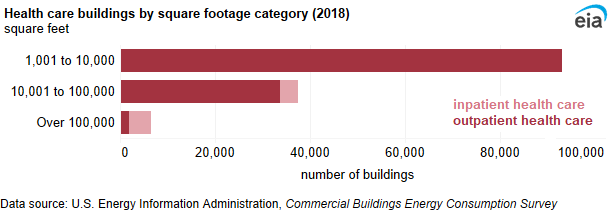
On average, health care buildings were 29,300 square feet per building. The size of inpatient health care buildings (hospitals) significantly affected the health care activity’s average floorspace. On average, hospitals were 264,800 square feet per building, but outpatient health care buildings averaged 13,700 square feet.
Energy use in health care buildings
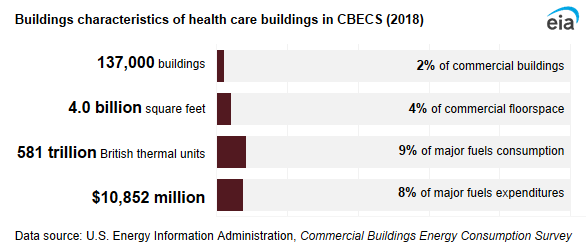
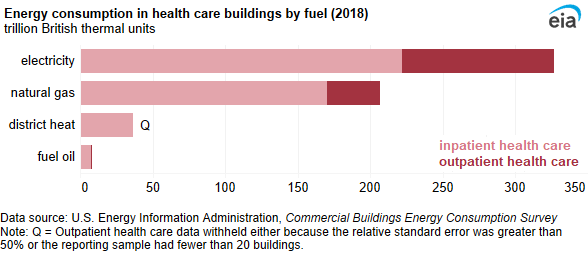
Health care buildings used 581 trillion British thermal units (TBtu) of energy in 2018. Although health care buildings accounted for 4% of total commercial floorspace, these buildings accounted for approximately 9% of energy consumption in commercial buildings. In health care buildings, electricity was the most-used fuel (327 TBtu), followed by natural gas (207 TBtu). Although inpatient health care buildings accounted for only 7% of all health care buildings, these buildings accounted for most of the energy consumption. Inpatient health care buildings accounted for 68% of health care’s electricity consumption and 82% of health care’s natural gas consumption.
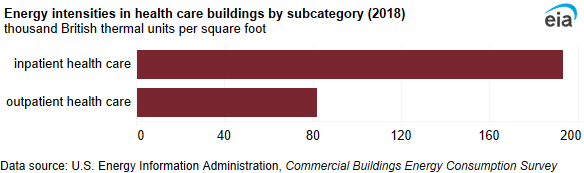
Although health care energy intensity was 144.5 thousand British thermal units (MBtu) per square foot, the intensities differed significantly between inpatient and outpatient health care buildings. Inpatient health care buildings used 193.3 MBtu per square foot, and outpatient health care buildings used 82.0 MBtu per square foot.
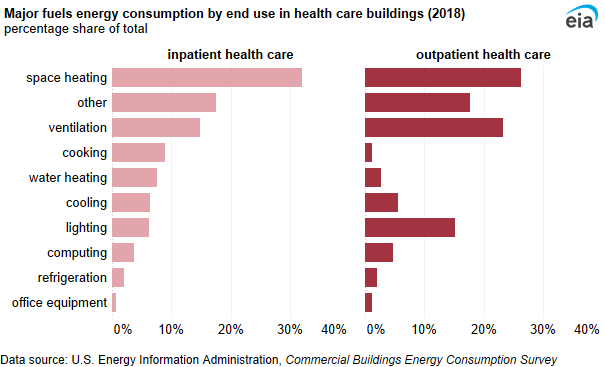
Space heating accounted for the largest share of end-use consumption for both inpatient (32%) and outpatient (26%) health care buildings. Inpatient health care had a larger share of its consumption dedicated to cooking (9%) and water heating (8%), although outpatient health care had larger shares of its consumption dedicated to ventilation (23%) and lighting (15%).
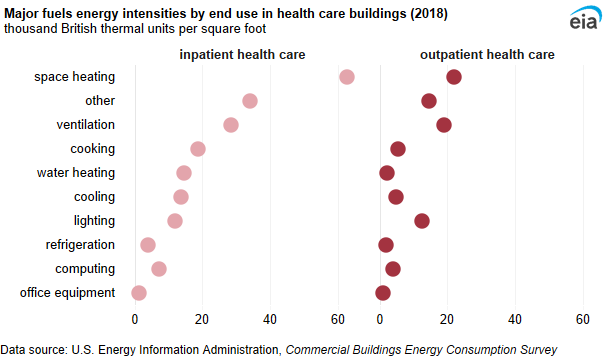
Although space heating accounted for the largest share of end-use consumption for both inpatient and outpatient health care buildings, the space heating intensity for inpatient health care (62.6 MBtu per square foot) was almost three times higher than the space heating intensity for outpatient health care (21.8 MBtu per square foot). When considering all commercial buildings, inpatient health care buildings had the highest space heating and ventilation intensities.
Inside health care buildings
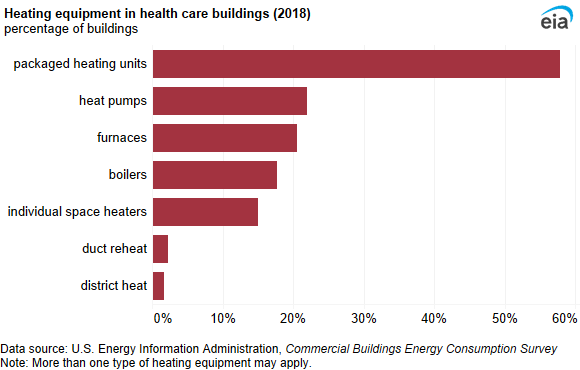
Packaged heating units were the most common heating equipment (58%) in health care buildings. Heat pumps were the second-most-used heating equipment (22%).
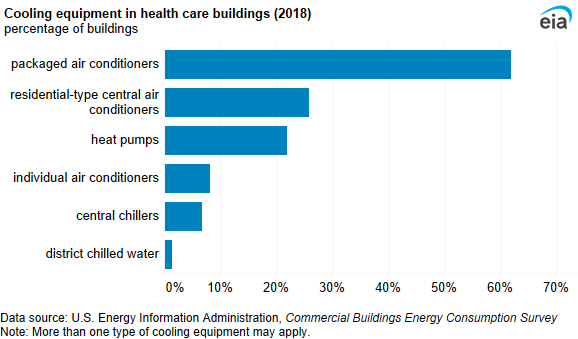
Packaged air conditioners were the most common cooling equipment (62%) in health care buildings. The second-most-used cooling equipment in health care buildings was residential-type central air conditioners (26%).
The majority of health care buildings (81%) had medical equipment. Among the health care buildings without medical equipment, most buildings were clinics or other outpatient health care and rehabilitation centers. X-ray machines were the most common medical equipment and were used in 66% of health care buildings.
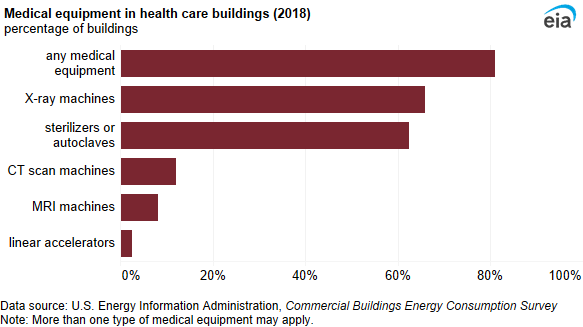
One-fourth of health care buildings used lab equipment, which includes fume hoods, gas chromatographs, centrifuges, spectrometers, and analysis equipment. Most lab equipment (83%) was used in outpatient health care buildings. Sterilizers or autoclaves were used in 62% of health care buildings. Approximately one-fourth (24%) of outpatient health care buildings had operating rooms used for outpatient surgery.
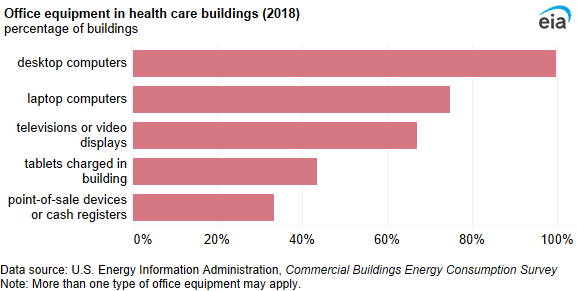
Most health care buildings had desktop computers, and three-fourths of health care buildings had laptops. Televisions and video displays were used in 67% of health care buildings, and tablets were charged in 44% of health care buildings. One-third of health care buildings had at least one cash register or point-of-sale device.
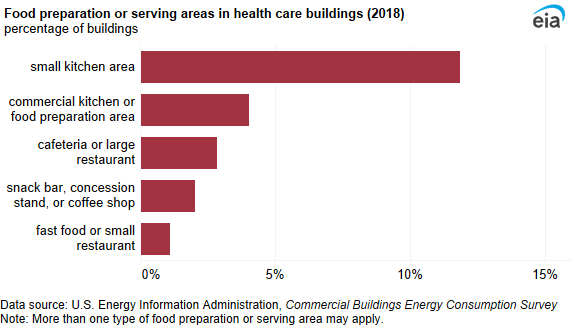
Most health care buildings did not have areas for food preparation or serving. Small kitchen areas were the most common and were used in only 12% of all health care buildings. Commercial kitchen or food preparation areas were found in 4% of all health care buildings but in 56% of inpatient health care buildings; cafeterias or large restaurants were found in 3% of all health care buildings but in 44% of inpatient health care buildings.