 2018 CBECS: Principal Building Activities
Lodging
Lodging buildings offer multiple accommodations for short-term or long-term residents and include skilled nursing and other residential care buildings.
We publish five subcategories of lodging buildings:
- Hotel
- Motel or inn
- Dormitory, fraternity, or sorority
- Nursing home or assisted living
- Other lodging, which includes convents, monasteries, halfway houses, shelters, group homes, and retirement homes
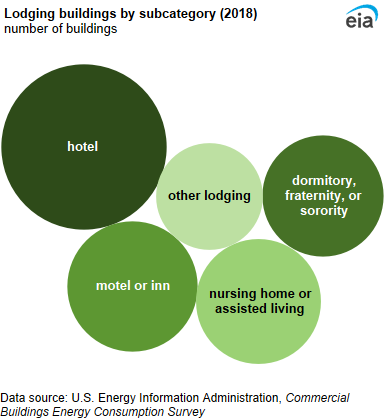
Hotels accounted for 32% of all lodging buildings. Motels or inns; nursing homes or assisted living facilities; and dormitory, fraternity, or sorority buildings each accounted for about 20% of lodging buildings.
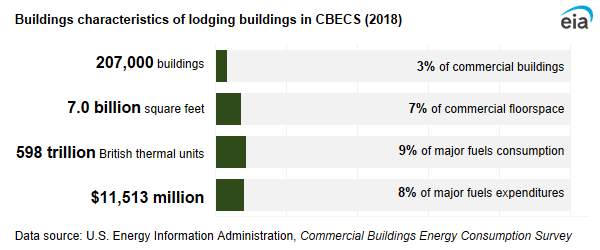
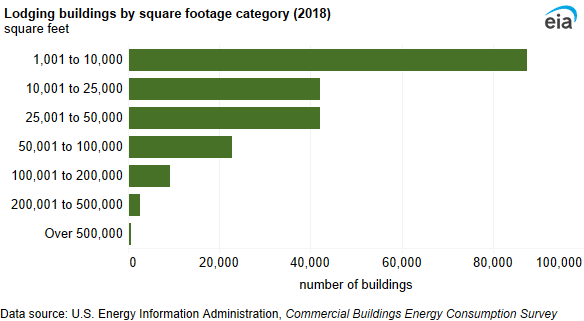
Approximately 42% of lodging buildings were between 1,001 square feet and 10,000 square feet. On average, lodging buildings were among the largest commercial building types (33,700 square feet per building). More than one-half (56%) of lodging buildings were on a campus or complex.
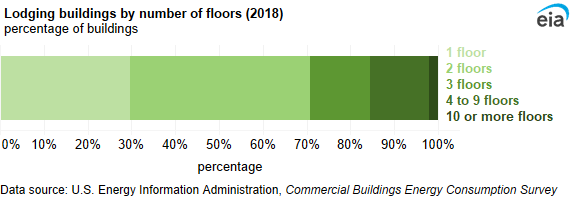
The majority of lodging buildings were not tall—only 2% of lodging buildings had 10 or more floors. Buildings that had one or two floors accounted for 71% of all lodging buildings.
Energy use in lodging buildings
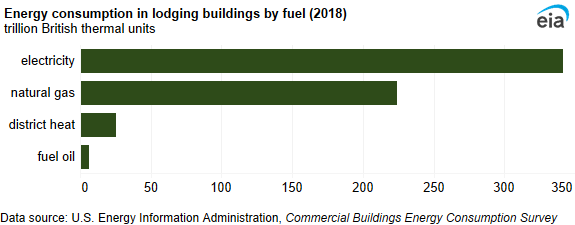
Lodging buildings used 598 trillion British thermal units (TBtu) of energy in 2018. Although lodging buildings accounted for 7% of total commercial floorspace, these buildings accounted for 9% of energy consumption in commercial buildings. Electricity was the most-used fuel (342 TBtu), followed by natural gas (224 TBtu). The mean energy intensity for lodging buildings was 85.7 thousand British thermal units (MBtu) per square foot.
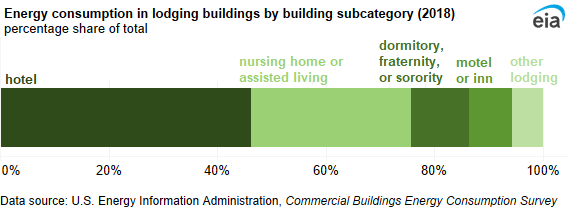
Hotels (46%) and nursing homes or assisted living facilities (30%) accounted for over three-fourths of energy consumption in lodging buildings.
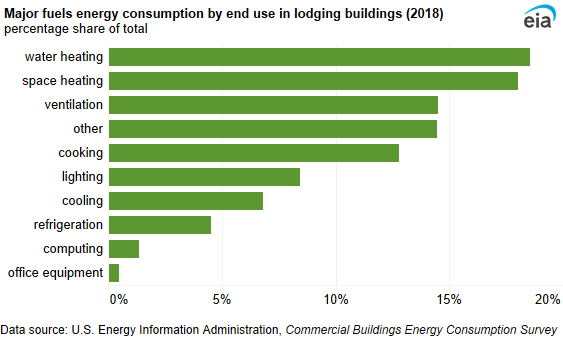
Water heating and space heating each accounted for about 20% of end-use energy consumption. Lighting, cooling, refrigeration, computing, and office equipment each accounted for 10% or less of end-use energy consumption.
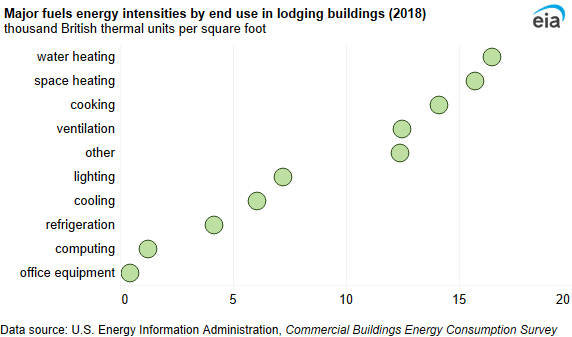
Energy intensity was highest for water heating (16.5 MBtu per square foot) and lowest for office equipment (0.4 MBtu per square foot).
Inside lodging buildings
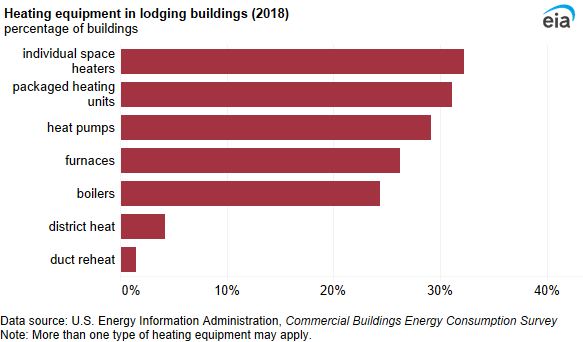
Individual space heaters were the most common heating equipment in lodging buildings (32%), followed by packaged heating units (31%), heat pumps (29%), furnaces (26%), and boilers (24%).
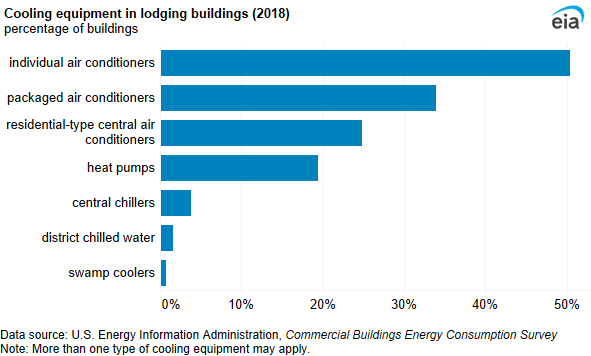
Individual air conditioners were used for cooling in one-half of lodging buildings. Packaged air conditioners and residential-type central air conditioners were each used in at least 25% of all lodging buildings.
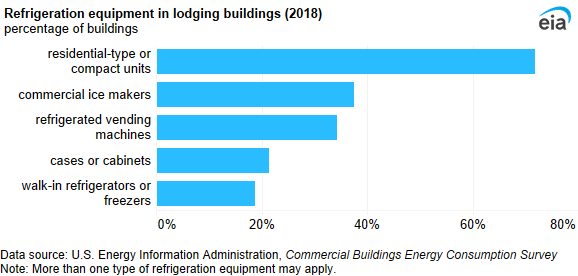
Approximately 72% of lodging buildings had residential-type or compact refrigeration units. Commercial ice makers (38%) were the second-most-used refrigeration equipment, and refrigerated vending machines were the third-most-used.
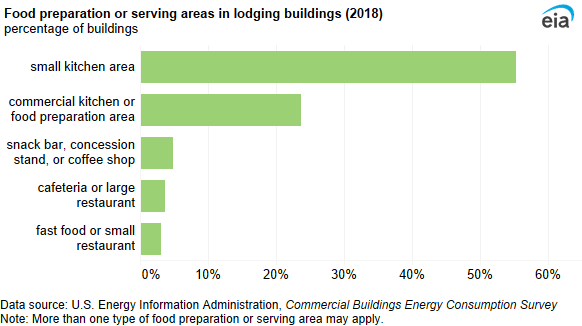
More than one-half (55%) of lodging buildings had small kitchen areas. Commercial kitchens or food preparation areas were the second-most common food-related areas and were used in 24% of lodging buildings.
We asked lodging building occupants about any activities that required large amounts of hot water, such as a commercial dishwasher, laundry room, heated pool, steam room, whirlpool, or showers. Approximately 63% of lodging buildings used large amounts of hot water. We also asked lodging building occupants if linens were laundered in the surveyed building, in another building on-site, or by an off-site laundry service. Approximately 64% of lodging buildings had laundry spaces within the surveyed building. Only 8% of lodging buildings had indoor pools.
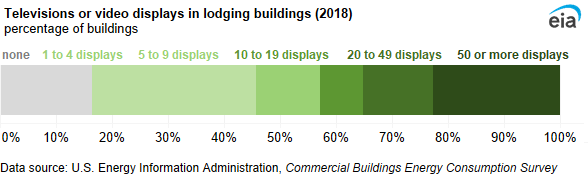
When compared to all commercial buildings, lodging buildings had the largest percentage of buildings with at least one television or video display (84%). When looking at lodging buildings specifically, lodging buildings with one to four televisions accounted for the largest percentage (29%), followed by lodging buildings with 50 or more televisions or video displays (23%).