
EIA’s top accomplishments of 2023
For the U.S. Energy Information Administration (EIA), 2023 was a year of notable accomplishments. Check out the highlights of EIA products and programs this year.
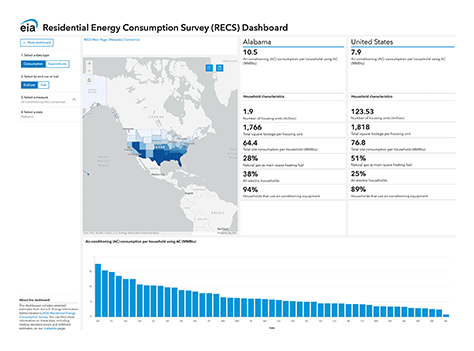
Launched the Residential Energy Consumption Survey Dashboard and released new data
In August, we launched an interactive dashboard that displays data from our 2020 Residential Energy Consumption Survey (RECS). It includes national-level and state-level estimates for selected residential energy consumption, expenditures, and household characteristics.
In March, we released the final public-use housing characteristics microdata file and tables for RECS, which include data on square footage and final data on household energy insecurity. The microdata file and tables encompass results from nearly 18,500 households, the largest responding sample in program history.
In March, we published the first set of consumption and expenditures tables. For the first time, we included estimates for all 50 states and the District of Columbia. The 18 tables in this release include total consumption, total expenditures, and energy-intensity estimates for electricity, natural gas, propane, and fuel oil. In June, we published the final set of consumption and expenditures tables, which include estimates of energy consumption and expenditures by end use (for example, air conditioning and water heating).
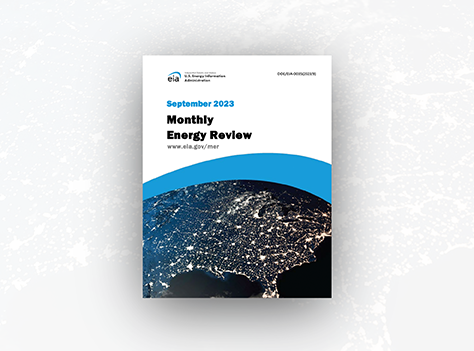
Updated primary energy calculation for renewables to be consistent with international standards
We updated the way we calculate primary energy consumption of electricity generation from noncombustible renewable energy sources (solar, wind, hydroelectric, and geothermal). Beginning with the September Monthly Energy Review, we calculated this value using the captured energy approach, which applies a constant conversion factor of 3,412 British thermal units per kilowatthour, the heat content of electricity. The captured energy approach is more consistent with international energy statistics standards than our previous approach.
Introduced new Short-Term Energy Outlook supplements and data series
Our Short-Term Energy Outlook (STEO) had many firsts in 2023.
In January, we published the inaugural edition of STEO Between the Lines, a new periodic supplement that provides extended analysis of issues in our forecast. In April, we introduced a deeper analysis called Perspectives, which analyzes additional STEO cases, describes new or revised forecast series, and explains methodological changes in short-term energy modeling.
In March, for the first time, we included all types of U.S. electric generation capacity in our forecast. In addition to the capacity series for renewable energy technologies, we added our generation capacity forecasts for natural gas, coal, petroleum, nuclear, and selected electricity storage technologies. In September, we included a forecast of propane spot prices for the first time.
Our Winter Fuels Outlook 2023–24 (WFO), which we released at a public event in October, now includes monthly expenditure data for all four heating fuels. During the heating season, the STEO also now includes a WFO monthly forecast update, which shows how our forecast for this key series has evolved.
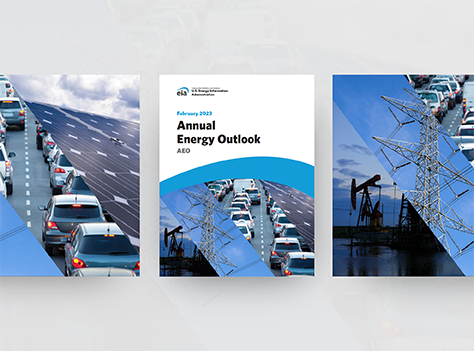
Released the Annual Energy Outlook
The Annual Energy Outlook 2023 (AEO2023) explores long-term energy trends in the United States. After we released AEO2022, the Inflation Reduction Act (IRA) altered the policy landscape we were using to develop our projections. The AEO2023 appendix explains how we implemented the IRA. The discussion section illustrates new measures of uncertainty that we are developing for future AEO projections.
We also released an Issues in Focus paper that explores how the IRA affects our model-based projections. A second Issues in Focus paper discusses how liquefied natural gas exports affect average U.S. natural gas prices. Lastly, we added new cases that combine assumptions from our macroeconomic and zero-carbon technology cost cases. These new cases combine demand-side changes (macroeconomic growth affecting energy demand) and supply-side changes (renewables costs affecting generation capacity deployment) to expand the range of projections in the AEO.
We presented our AEO2023 at a virtual public event hosted by Resources for the Future on March 16.
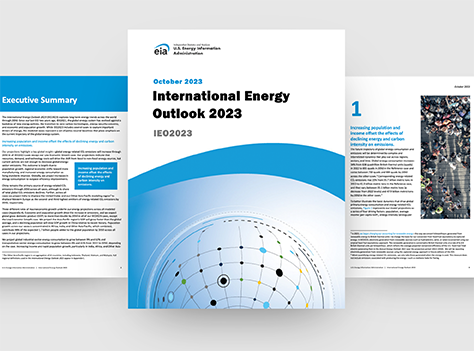
Released the International Energy Outlook
The International Energy Outlook 2023 (IEO2023) explores long-term energy trends around the world through 2050. Since the IEO2021 release, energy markets have gone through significant short-term market volatility associated with economic growth as the world returns to pre-pandemic levels of economic activity. The political instability associated with Russia's full-scale invasion of Ukraine has also contributed to volatility. IEO2023 Appendix B discusses the assumptions we made around the invasion and how we represented it in our analysis.
On October 11, we participated in the release event of the IEO2023 hosted by the Center for Strategic and International Studies. During the event, we shared the report’s highlights and key assumptions and discussed how the projections can be helpful in informing policymakers.
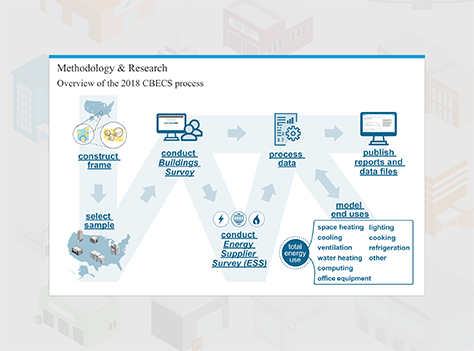
Published new methodology and supplemental reports for the Commercial Buildings Energy Consumption Survey
In April, we released new methodology reports about how we gathered information for the 2018 Commercial Buildings Energy Consumption Survey (CBECS). The reports explain the CBECS process, including information about:
- Constructing a frame
- Selecting a sample
- Conducting the Buildings Survey and the Energy Supplier Survey
- Processing the data
- Modeling energy end-use consumption
For the first time in a CBECS cycle, we used satellite images to create a sampling frame and gave respondents an option to complete the survey online. We also published a new series of building-type reports with graphs and data highlights for each of the 14 building types. In each report, we show how much the building type contributes to the building stock, floorspace, energy consumption, and expenditures. We also discuss the building type subcategories. In addition, we conducted a web survey to understand how the pandemic affected infrastructure in commercial buildings. The results will inform future CBECS data collections.
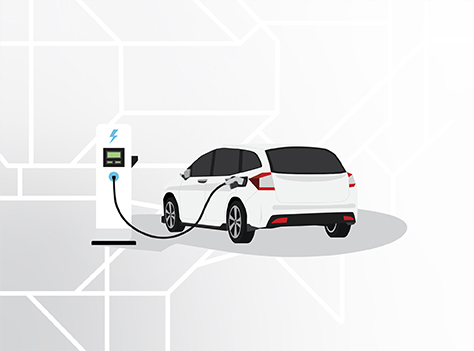
Added electric vehicle data to the Monthly Energy Review
In August, we added Appendix F and Table F1, Electric Vehicle Charging Infrastructure, to the Monthly Energy Review. The new appendix presents data on the number and type of electric vehicle charging locations and ports. In addition, we added a file with state-level infrastructure data on electric vehicle charging stations and a file that contains the full charging infrastructure dataset. The appendix also documents our methodology and sources. In May, we added a table that presents data on registered battery, plug-in hybrid, and fuel cell electric vehicles.

Improved reporting on crude oil balances in the Petroleum Supply Monthly and the Weekly Petroleum Status Report
In the August release of our Petroleum Supply Monthly, we added new data, labeled Transfers to crude oil supply, to the national and regional volumetric balance tables for petroleum and biofuels. Transfers to crude oil supply include barrels of unfinished oils (refinery feedstocks) and natural gas liquids that we identified were blended into the crude oil supply.
In addition, we also added Transfers to crude oil supply to the national volumetric balance table for petroleum and biofuels in the Weekly Petroleum Status Report, beginning in November 2023.

Added state-level renewable diesel data to the State Energy Data System
In April, we added new renewable diesel statistics to our State Energy Data System, including annual renewable diesel production and consumption estimates by state for 2011 through 2021. Previously, we published only national-level renewable diesel production and consumption data in the Petroleum Supply Monthly and the Monthly Energy Review.
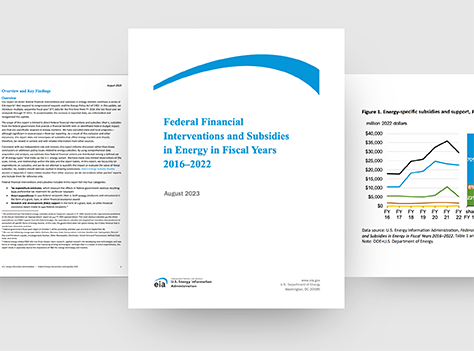
Expanded our federal financial interventions and subsidies report to include seven years of estimates
Our Federal Financial Interventions and Subsidies in Energy in Fiscal Years 2016–2022 report updated a series of EIA studies on federal energy subsidies that allocate tax and direct expenditure activities into 14 energy types across seven fiscal years (2016–2022). We performed our first federal energy subsidies study at Congress’s request in fiscal year 1992, and we last updated this report in 2018.

Migrated to a state-of-the-art data center
We completed significant upgrades to our technological infrastructure to better and more reliably support our users. Upgrading our IT infrastructure has better positioned us to successfully meet our mission of delivering data and information to promote sound policymaking, efficient markets, and public understanding of energy and its interaction with the economy and the environment.

Engaged with energy experts, statistical experts, and EIA stakeholders
We strengthened relationships with energy experts and stakeholders at the local, state, national, and global level through our various webinar events.
- APIv2 Webinar, January 11
- This webinar summarized the new features of API version 2.1. - 2018 Commercial Buildings Energy Consumption Survey (CBECS): Highlights and Methods, April 19
- This presentation described U.S. commercial buildings stock and energy consumption in 2018, showed how we collected the data, and offered tips for using CBECS data. - Estimating Heating and Other Uses in the 2020 Residential Energy Consumption Survey (RECS), August 29
- The webinar featured data highlights, a demonstration of the new RECS state-data dashboard, and a summary of end-use estimation methods. - Annual meeting with the American Statistical Association’s Committee on Energy Statistics (ASA), September 18–20
- During the annual meeting, we discussed survey methodology and other technical issues with statistical experts. - Project BlueSky initiative, November
- We hosted a number of webinars to share our plans to develop a next-generation energy model, which will eventually be used to produce EIA’s long-term projections. - International Nuclear Workshop, December 5–6
- We hosted the in-person International Nuclear Workshop to address global nuclear power projections in support of the International Energy Outlook and mid-term energy analysis.