Issues in Focus: Effects of Liquefied Natural Gas Exports on the U.S. Natural Gas Market

Executive Summary
To explore the effects of future U.S. liquefied natural gas (LNG) export volumes on domestic natural gas prices, we examined a range of potential LNG price and investment drivers using the same model we used to develop our Annual Energy Outlook 2023 (AEO2023). The amount of U.S. LNG export capacity that will ultimately be built remains uncertain, and how this incremental capacity would affect domestic prices, consumption, and supply is a topic of interest in energy markets.
We designed three additional cases (beyond those in our AEO2023) that looked at lower international natural gas prices (Low LNG Price), higher international natural gas prices (High LNG Price), and higher prices with faster development of export facilities than we allowed in our AEO2023 cases (Fast Builds Plus High LNG Price). Across these cases, we found that LNG export volumes affected the resulting annual average U.S. natural gas price (Table 1). The resulting variation in natural gas prices in these three cases, however, was narrower than recent in history and our AEO2023, despite a wide variety of U.S. LNG export volumes.
LNG exports from the United States have steadily grown since 2016, when the first liquefaction unit—or train—at Sabine Pass in Louisiana entered service. Following several years of LNG capacity additions, the United States became the world’s largest LNG exporter during the first half of 2022, when U.S. LNG exports averaged nearly 11.2 billion cubic feet per day (Bcf/d), about 12% of the dry natural gas1 produced in the United States. In AEO2023, we project that total natural gas exports, by pipeline or as LNG, will become larger than any domestic end-use sector, including residential, commercial, industrial, and electric generation, by the early 2030s to become the largest component of U.S. natural gas demand in the AEO2023 Reference, High Oil Price, and High Oil and Gas Supply Cases.
| Reference | Low LNG Price | High LNG Price | Fast Builds Plus High LNG Price | 2018–22 Range | ||
|---|---|---|---|---|---|---|
| Low | High | Liquefied natural gas (LNG) exports (Bcf/d) | 27.3 | 15.3 | 39.9 | 48.2 | 3.0 | 10.8 |
| Henry Hub spot price (2022$/MMBtu) | $3.77 | $3.28 | $4.31 | $4.81 | $2.23 | $6.52 |
| Natural gas consumption (Bcf/d) | 82.2 | 82.5 | 81.9 | 81.7 | 82.7 | 87.7 |
| Industrial natural gas consumption, excluding lease and plant fuel (Bcf/d) | 27.3 | 27.4 | 26.9 | 26.7 | 22.2 | 23.3 |
| Electric power natural gas consumption (Bcf/d) | 21.2 | 22.8 | 19.7 | 18.6 | 29.0 | 32.3 |
| Natural gas share of electricity generation | 22% | 23% | 20% | 19% | 34% | 40% |
| Electric power price (2022¢/kWh) | 11.0¢ | 11.0¢ | 11.1¢ | 11.2¢ | 12.1¢ | 12.3¢ |
| Data source: U.S. Energy Information Administration, Annual Energy Outlook
2023 Note: Bcf/d=billion cubic feet per day, $/MMBtu=dollars per million British thermal units, ¢/kWh=cents per kilowatthour |
||||||
LNG export facilities in the United States have a combined operating capacity under real world operating conditions of 11.4 Bcf/d with an additional 7.3 Bcf/d of capacity under construction. A further 18.3 Bcf/d of possible LNG export capacity has received full regulatory approval from the U.S. Department of Energy (DOE) and the Federal Energy Regulatory Commission (FERC) but has not yet received a final investment decision, an important step before construction can begin.
Within the model, the key determinants of LNG export volumes are international LNG prices and the rate at which new LNG export terminals can be constructed. Model results showed that higher LNG exports results in upward pressure on U.S. natural gas prices and that lower U.S. LNG exports results in downward pressure. Our projected price of U.S. natural gas at the Henry Hub in 2050 varied from $3.30 per million British thermal units (MMBtu) to $4.80/MMBtu, depending on the volume of U.S. exports in the cases we explored. In the AEO2023 Reference case, we projected a price of nearly $3.80/MMBtu, and we projected prices as high as nearly $6.40/MMBtu in the Low Oil and Gas Supply Case and as low as nearly $2.80/MMBtu in the High Oil and Gas Supply case.
Future dry natural gas production ranged from 104.1 Bcf/d in the Low LNG Price case to 134.6 Bcf/d in the Fast Builds Plus High LNG Price case, based on varying amounts of U.S. LNG exports. Natural gas production on the Gulf Coast and in the Southwest was the most affected by LNG export volumes because these producing regions are located near LNG export terminals.
We saw lesser effects on domestic natural gas consumption. Natural gas consumption in the electric power sector was the most sensitive to the varying U.S. LNG export volumes, ranging from a 7% increase in the Low LNG Price case to a 12% decrease in the Fast Builds Plus High LNG Price case compared with the Reference case in 2050. Natural gas consumption in the manufacturing sector responded slightly to natural gas price signals, ranging from a low of 26.7 Bcf/d in the Fast Builds Plus High LNG Price case to a high of 27.4 Bcf/d in the Low LNG Price case. In total, U.S. natural gas consumption changed only slightly across the cases because decreases in domestic consumption are largely offset by additional natural gas consumption required to support higher levels of LNG production and transmission. Total consumption varied from a 0.4% increase in the Low LNG Price case to a 0.8% decrease in the Fast Builds Plus High LNG Price case relative to the Reference case.
Analysis Design and Case Description
To assess how U.S. LNG exports responded to different assumptions about international LNG prices and the corresponding effects that those prices would have on the U.S. natural gas market, we developed three cases using our National Energy Modeling System (NEMS). These three cases incorporate assumptions that drive variations in the amount of LNG the United States will export through 2050.
We model U.S. energy markets explicitly in NEMS. Through 2027, the Reference case and all side cases published in AEO2023 incorporate U.S. LNG export projects that are either operating or under construction as of August 2022. After 2027, the cases run through NEMS add more U.S. LNG export capacity based on price differentials between international LNG prices and the cost of exporting LNG from the United States for delivery in Asia and Europe, along with annual constraints on the ability to build new capacity. As international LNG prices increase compared with domestic natural gas prices, U.S. LNG export capacity becomes more economical to build.
Up to the constraint on building new capacity, this price difference drives the amount of U.S. LNG that is exported within the model.2 In all cases, NEMS assumes that a maximum of 90% of baseload capacity can be utilized, which reflects real world operating conditions of LNG export facilities. The utilization of LNG export capacity might be further reduced if the regional spot price plus liquefaction, shipping, and regasification costs exceeds the LNG price in Asia or Europe.3
We developed two side cases, Low LNG Price and High LNG Price, in which we adjust assumptions in NEMS that change projected international LNG prices in Europe and Asia. These prices help determine the economics of building liquefaction facilities and exporting LNG given U.S. natural gas prices, shipping costs, and LNG prices abroad. We developed a third side case, the Fast Builds Plus High LNG Price case, which uses the same price parameters as the High LNG Price case. In addition, this case loosens the additional constraints we place in NEMS on how quickly new LNG export capacity is allowed to come online, which represents growing investments and efficiency gains in the construction of liquefaction units and allows more of these facilities to be constructed simultaneously in the model.
All three cases assume current laws and regulations, including our integration of the Inflation Reduction Act (IRA), with provisions as defined in the Appendix of the AEO2023 narrative. We use macroeconomic assumptions from S&P Global IHS Markit as of November 2022.
| Case | Description |
|---|---|
| Reference case | We assume that up to three natural gas liquefaction trains, each with 200 billion cubic feet (Bcf) capacity, are built each year (a maximum of 600 Bcf of liquefied natural gas [LNG] capacity). This constraint on new capacity represents our assessment of the logistical challenges in building such large, complex facilities. We assume that world natural gas prices start at their recent historical ratio to the world oil price. Over time, the price of LNG becomes less tied to the world oil price as the ratio of flexibly priced LNG to the representative regional net natural gas demand increases relative to its base year level. The ratio reflects the tightness or looseness of the world LNG market pushing or pulling, respectively, world natural gas prices toward or away from the world oil price. |
| High LNG Price case | The High LNG Price case assumes that LNG prices in Europe and Asia are higher by an average of nearly 25% relative to the Reference case in 2050. |
| Low LNG Price case | The Low LNG Price case assumes that LNG prices in Europe and Asia are lower by an average of nearly 20% relative to the Reference case in 2050. |
| Fast Builds Plus High LNG Price case | In the Fast Builds plus High LNG Price case, we use the same higher price assumptions from the High LNG Price case, but we also assume four natural gas liquefaction trains, each with 200 Bcf capacity, can be built each year (a maximum of 800 Bcf of LNG capacity), a level that likely remains technically feasible. |
| Data source: U.S. Energy Information Administration, Annual Energy Outlook 2023 | |
This analysis does not model international energy markets and so does not account for interactions between U.S. natural gas exports and world natural gas markets. We do not model constraints such as regasification capacity abroad, the availability of LNG tanker vessels, and potential competition from LNG exports originating in other countries, any one of which could affect U.S. LNG export volumes. In addition, we do not project the destination of U.S. LNG exports, nor do we account for shocks to the market. For example, the most recent international natural gas consumption nputs to the model come from our International Energy Outlook 2021 and so do not account for recent events, such as Russia’s full-scale invasion of Ukraine.
NEMS optimizes the disposition of natural gas between domestic sectors and exports to the international market. When international prices rise, it creates incentives for more LNG exports because adding new LNG capacity becomes more economical as the spread between the cost of producing LNG in the United States and the price that exporters can sell the LNG abroad increases. Domestic natural gas prices and production rise to balance the market and meet U.S. natural gas consumption and exports according to supply curves. Within the domestic market, the degree to which the model can substitute natural gas for other sources varies by sector. In the electric power sector, for example, sources such as renewables plus battery storage is a viable alternative source for natural gas when natural gas prices rise.
Natural gas demand in the residential and commercial sectors is less sensitive to changes in the natural gas price compared with the electric power sector. Although sufficiently high natural gas prices can encourage increased electrification of the residential and commercial sectors, natural gas consumption in those sectors is primarily determined by long-term trends in space-heating demand. The Low LNG Price, High LNG Price, and Fast Builds Plus High LNG Price cases use the same macroeconomic and value of shipment assumptions as the AEO2023 Reference case. Because of limited macroeconomic feedback associated with changes in natural gas prices in those cases, consumption changes in some other sectors, such as manufacturing, is limited.
Results and Discussion
Higher world LNG prices increase U.S. LNG exports
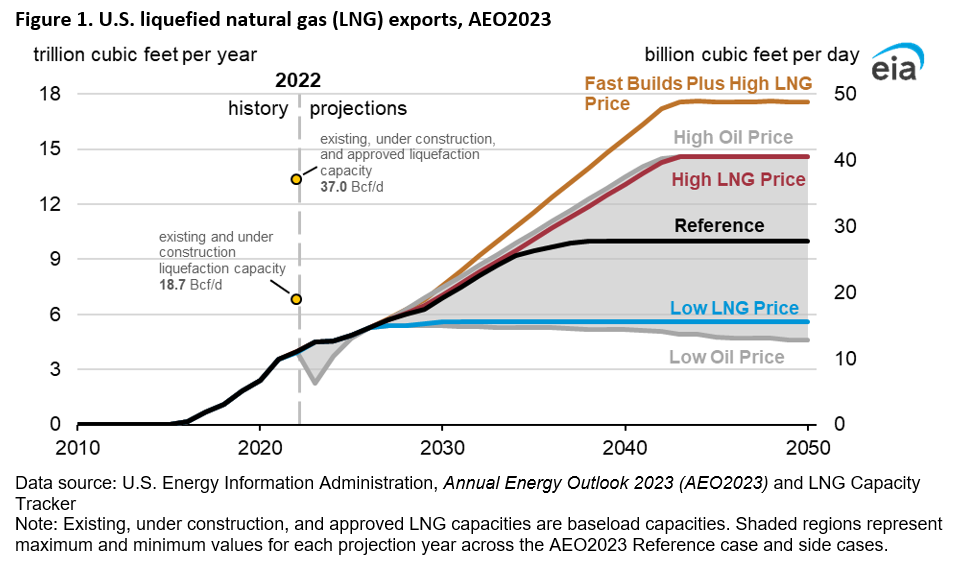
The High LNG Price and Fast Builds Plus High LNG Price cases explore how high international LNG prices could affect U.S. LNG exports. By 2050 in the High LNG Price case, exports rise 46% to 39.9 Bcf/d, and in the Fast Builds Plus High LNG Price case, they rise 76% to 48.2 Bcf/d, compared with 27.3 Bcf/d in Reference case. For comparison, U.S. LNG exports also reach 39.9 Bcf/d in the AEO2023 High Oil Price case, the highest projected volume of LNG exports in any of the side cases we published in AEO2023.
In both the Reference case and the High LNG Price case, the United States exports almost the same amount of LNG through 2034 because our limit of three new LNG export facilities a year determines maximum U.S. exports from 2029 through 2035 (Figure 1). When we relax the capacity build limitations in the Fast Builds Plus High LNG Price case, we project builders have enough incentive to add U.S. LNG export capacity at the maximum allowable rate of 800 Bcf/d per year between 2030 and 2042 and exceed the 37.0 Bcf/d baseload capacity that has currently received fully regulatory approval from DOE and FERC through 2038. This baseload capacity includes approved export capacity of 18.3 Bcf/d that is not currently operational or under construction and has not yet received a final investment decision.
In NEMS, domestic natural gas prices and international LNG prices are dynamic through the projection period because of feedback from LNG exports. As U.S. LNG exports increase, the international LNG market loosens, decreasing LNG prices. Likewise, higher LNG exports create a tighter domestic natural gas market (all else held equal), increasing domestic natural gas prices. Because of these two relationships, as the United States exports more LNG, the spread between domestic natural gas prices and international LNG prices eventually declines to a point of equilibrium where it is no longer economical to construct more LNG capacity, limiting LNG exports in the projection period.
In the Low LNG Price case, prices do not support building additional U.S. LNG export capacity in addition to what is already under construction in NEMS through 2050. Lower international prices result in a projected 15.3 Bcf/d of LNG exports in 2050, 44% less than in the AEO2023 Reference case.
The natural gas spot price is influenced by changing LNG export volumes
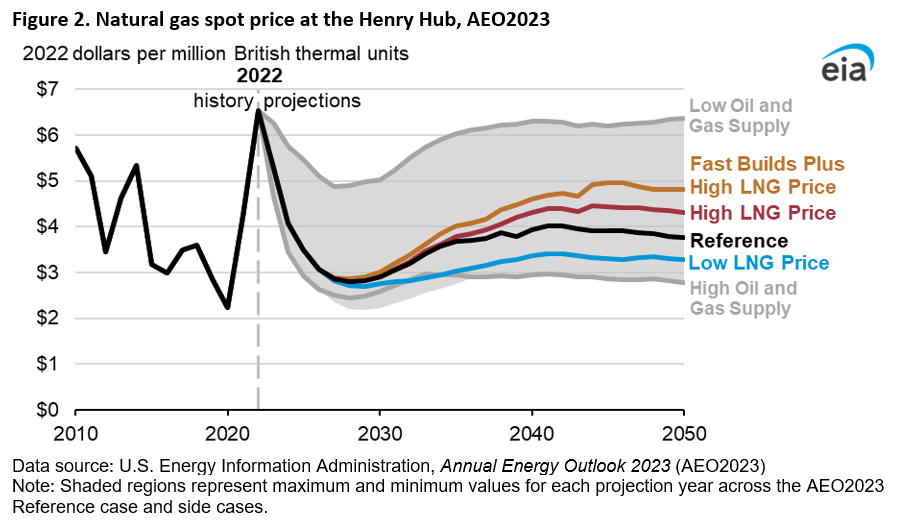
We project that through 2050 additional U.S. LNG exports would increase the natural gas spot price at the Henry Hub, the benchmark natural gas spot price in the United States, although not beyond recent history or the highest AEO2023 case (Figure 2). Because end-use natural gas prices are influenced by spot prices, rising natural gas spot prices ultimately affect natural gas prices for consumers in all U.S. end-use sectors to some degree. Delivered natural gas prices for industrial and electric power consumers tend to cause changes in spot prices more directly because delivery costs to those sectors incorporate less fixed charges compared with the residential and commercial sectors.
In the High LNG Price case, the Henry Hub spot price reaches about $4.30/MMBtu by 2050 compared with the Reference case price of nearly $3.80/MMBtu. The increase in natural gas demand resulting from higher LNG exports in the Fast Builds Plus High LNG Price case results in an even higher projected Henry Hub price, reaching about $4.80/MMBtu in 2050. By contrast, the annual Henry Hub spot price averaged $6.52/MMBtu in 2022, and our projected 2050 price in the AEO2023 Low Oil and Gas Supply case is nearly $6.40/MMBtu.
In the Low LNG Price case, where LNG exports do not grow during the projection period beyond planned builds, we project the Henry Hub spot price to be nearly $3.30/MMBtu in 2050. By contrast, the annual Henry Hub spot price averaged $2.23/MMBtu in 2020, and our projected 2050 price in the AEO2023 High Oil and Gas Supply case is nearly $2.80/MMBtu.
Natural gas production on the Gulf Coast is the most economical supply source to meet higher LNG export volumes
U.S. natural gas production varies across the cases to meet LNG export volumes. We project more natural gas production in the High LNG Price and Fast Builds Plus High LNG Price cases and less natural gas production in the Low LNG Price case than in the AEO2023 Reference case. In the High LNG Price case, 10% more natural gas is produced in the United States in 2050 relative to the 115.3 Bcf/d projected in the Reference case. In the Fast Builds Plus High LNG Price case, we project 17% more natural gas production in 2050 compared with the Reference case, reaching 134.6 Bcf/d in 2050. In the Low LNG Price case, natural gas production decreases by 10% compared with the Reference case in 2050. By comparison, in 2050, we project production of 80.2 Bcf/d in the Low Oil and Gas Supply case and 136.2 Bcf/d in the High Oil and Gas Supply case, the AEO2023 cases with lowest and highest natural gas production, respectively.
| AEO2023 side case | East | Gulf Coast | Southwest | Total dry gas production |
|---|---|---|---|---|
| Reference | 42.5 | 30.0 | 20.3 | 115.3 |
| Low LNG Price | 39.8 | 24.7 | 19.0 | 104.1 |
| High LNG Price | 44.3 | 36.1 | 22.3 | 127.1 |
| Fast Builds Plus High LNG Price | 45.1 | 39.8 | 23.9 | 134.6 |
| Low Oil Price | 39.4 | 26.2 | 11.2 | 96.1 |
| High Oil Price | 44.4 | 33.5 | 33.3 | 136.0 |
| Low Oil and Gas Supply | 35.4 | 18.9 | 12.0 | 80.2 |
| High Oil and Gas Supply | 44.1 | 36.6 | 25.4 | 136.2 |
| Data source: U.S. Energy Information Administration, Annual Energy Outlook 2023 (AEO2023) | ||||
Most of the projected increase in natural gas production in the High LNG Price and the Fast Builds Plus High LNG Price cases occurs in the Gulf Coast producing region, which includes the Eagle Ford and Haynesville plays (Figure 3 and Appendix). The Gulf Coast supplies most of the incremental natural gas destined for LNG export terminals in Texas and Louisiana because of favorable drilling economics, available existing natural gas pipeline capacity, and less expensive pipeline transportation. All new LNG capacity added through 2050 in these cases is in either Texas or Louisiana. In the AEO2023 Reference case, dry natural gas production on the Gulf Coast grows to 30.0 Bcf/d, or 26% of Lower 48 dry production, by 2050. Gulf Coast production grows to 36.2 Bcf/d in the High LNG Price case and to 39.9 Bcf/d in the Fast Builds Plus High LNG Price case, accounting for 29% and 30% of Lower 48 dry production, respectively. Gulf Coast production in the Fast Builds Plus High LNG Price case is nearly 9% higher in 2050 compared with the High Oil and Gas Supply case, despite higher total projected production in the High Oil in Gas Supply Case. This increase suggests that it is more favorable to supply growth in U.S. LNG exports with natural gas produced on the Gulf Coast than in other parts of the United States.
The Southwest region, which includes the Permian Basin and the Barnett play, has the second-fastest natural gas production growth in the High LNG Price case (22.2 Bcf/d) and Fast Builds Plus High LNG Price case (23.8 Bcf/d) by 2050, compared with 20.3 Bcf/d in the Reference case. However, the Southwest region’s share of total dry natural gas production remains constant in all four cases at 18%.
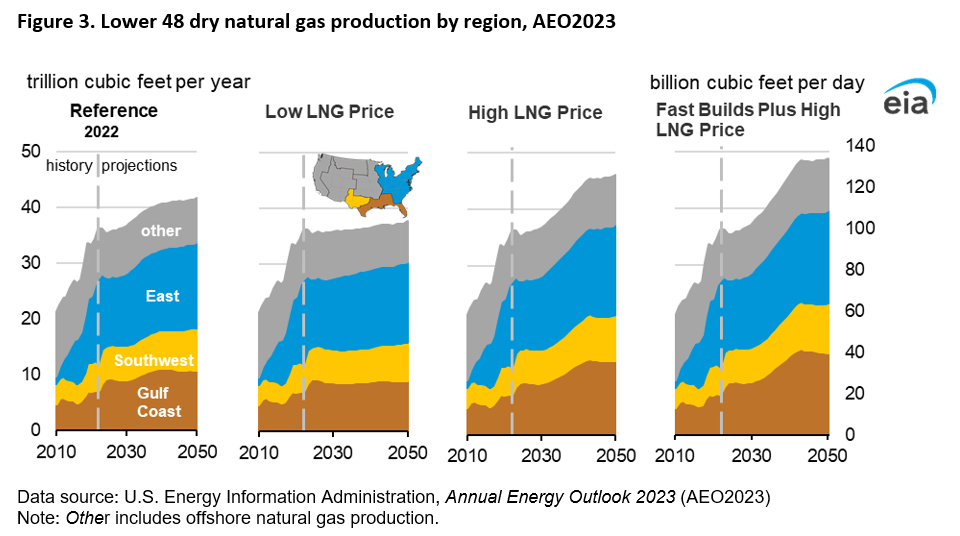
We project that less natural gas needed to support U.S. LNG exports in the Low LNG Price case results in 10% lower projected natural gas production in 2050, at 104.1 Bcf/d, compared with the AEO2023 Reference case. Like in the cases featuring higher LNG exports, the Gulf Coast region was the most responsive natural gas-producing region in the Low LNG Price case; projected production in the region was 18% lower than in the AEO2023 Reference case.
Despite varying amounts of U.S. LNG exports, domestic natural gas consumption varies by sector but changes very little in total
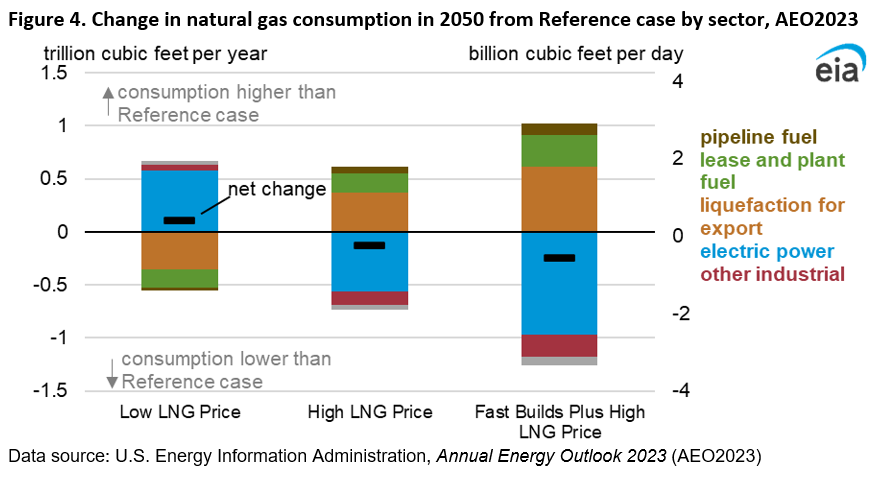
Despite the different natural gas prices produced in the cases we examined, our projected natural gas consumption in the United States changes relatively little between the cases (Table 4). Decreases in natural gas consumption in the end-use sectors is largely offset by increases in natural gas consumption associated with natural gas production, transport, and liquefaction (Figure 4).
| Reference | Low LNG Price | High LNG Price | Fast Builds Plus High LNG Price | Low Oil Price | High Oil Price | Low Oil and Gas Supply | High Oil and Gas Supply | |
|---|---|---|---|---|---|---|---|---|
| Total consumption | 82.2 | 82.5 | 81.9 | 81.6 | 76.4 | 92.8 | 65.1 | 97.1 |
| Residential | 12.9 | 12.9 | 12.9 | 12.8 | 12.8 | 12.9 | 12.5 | 13.0 |
| Commercial | 9.4 | 9.5 | 9.4 | 9.3 | 9.4 | 9.4 | 9.0 | 9.6 |
| Industrial | 33.8 | 33.4 | 33.9 | 34.0 | 30.2 | 38.3 | 29.1 | 39.9 |
| Other industrial | 27.3 | 27.4 | 26.9 | 26.7 | 25.3 | 30.4 | 24.9 | 31.6 |
| Lease and plant fuel | 6.5 | 6.0 | 7.0 | 7.3 | 5.0 | 7.9 | 4.2 | 8.3 |
| Electric power | 21.2 | 22.8 | 19.7 | 18.6 | 21.2 | 24.9 | 11.0 | 29.1 |
| Transportation | 4.9 | 3.8 | 6.0 | 6.8 | 2.7 | 7.3 | 3.4 | 5.4 |
| Vehicles | 0.8 | 0.8 | 0.8 | 0.8 | 0.1 | 1.9 | 0.7 | 0.8 |
| Pipeline fuel | 1.8 | 1.8 | 2.0 | 2.1 | 1.6 | 2.2 | 1.6 | 2.0 |
| Liquefaction for export | 2.2 | 1.0 | 3.1 | 3.9 | 1.0 | 3.2 | 1.1 | 2.6 |
| Data source: U.S. Energy Information Administration, Annual Energy Outlook 2023 | ||||||||
LNG export terminals consume some of the natural gas delivered to the facility to operate liquefaction equipment (liquefaction for export). In other words, as LNG exports rise, natural gas volumes consumed during the liquefaction process rise as well. Liquefaction for export volumes ranges from 0.8 Bcf/d in the Low LNG Price case to 3.8 Bcf/d in the Fast Builds Plus High LNG Price case. Natural gas consumption volumes from other sources also play a role in limiting total consumption differences between the cases. The amount of natural gas that is consumed in well, field, and lease operations (lease and plant fuel) increases with higher natural gas production, resulting in consumption for lease and plant fuel ranging from a low of 5.5 Bcf/d in the Low LNG Price case to a high of 7.3 Bcf/d in the Fast Builds Plus High LNG Price case. Natural gas volumes consumed during natural gas transportation through pipelines (pipeline fuel) generally increase as total natural gas demand (domestic and for export) increases. As a result, pipeline fuel consumption ranges from a low of 1.8 Bcf/d in the Low LNG Price case to a high of 2.1 Bcf/d in the Fast Builds Plus High LNG Price case.
Higher natural gas prices in the High LNG Price and Fast Builds Plus High LNG Price cases lead to moderately reduced electric power and manufacturing sector consumption relative to the Reference case, which is offset by increased natural gas consumption to support increased LNG exports.
In the Low LNG Price case, the reverse is true: higher natural gas consumption in the electric power sector relative to the Reference case, due to a lower Henry Hub price, offsets lower consumption for liquefaction and lease and plant fuel. U.S. natural gas consumption ranges from 81.6 Bcf/d in the Fast Builds Plus High LNG Price case in 2050 to 82.5 Bcf/d in the Low LNG Price case, a difference of 0.8 Bcf/d, or about 1%, between the cases.
Natural gas consumption in the U.S. electric power sector, which has historically been very responsive to changes to the natural gas spot price, continues to be most sensitive to the price changes resulting from varying U.S. LNG exports. In the AEO2023 Reference case, we project that natural gas consumption in the U.S. electric power sector falls from 32.3 Bcf/d in 2022 to 21.1 Bcf/d by 2050, driven by growth in renewable sources. However, we project that natural gas consumed in the U.S. electric power sector in 2050 ranges from as little as 18.6 Bcf/d in the Fast Builds Plus High LNG Price case, a 12% decrease, to as much as 22.7 Bcf/d in the Low LNG Price case, an 8% increase, compared with the AEO2023 Reference case.
In the High LNG Price and Fast Builds Plus High LNG Price cases, competition for natural gas volumes shifts natural gas toward LNG exports and away from the electric power sector. The subsequent declining natural gas consumption in the electric power sector changes the electricity generation mix. Natural gas’s share of U.S. electric power generation declines to a low of 19% by 2050 in the Fast Builds Plus High LNG Price case compared with 22% in the Reference case. We project that electricity generation from renewable sources replaces most of the decline in natural gas-fired generation due to increased LNG exports; however, coal and nuclear power generation increase slightly as well.
In the Low LNG Price case, we project only marginal differences in the electricity generation mix compared with the Reference case. We project that natural gas’s share of electricity generation in this case will be 23% in 2050, only slightly more than in the Reference case. The increase in natural gas’s share of electric power generation reduces renewable energy generation and, to some degree, coal-fired generation as well. We also find negligible differences in average electricity prices between the cases, ranging from a low of 11.0 cents per kilowatthour (¢/kWh) in the Low LNG Price case to a high of 11.2¢/kWh in the Fast Builds Plus High LNG Price case.
Natural gas consumption in the manufacturing sector (known in AEO2023 as other industrial) is slightly responsive to natural gas price signals, ranging from a low of 26.7 Bcf/d in the Fast Builds Plus High LNG Price case to a high of 27.5 Bcf/d in the Low LNG Price case. Generally, natural gas consumption in the manufacturing sector is moderately responsive to changes in natural gas prices but less responsive than natural gas consumption in the electric power sector. Instead, natural gas consumption for manufacturing primarily responds to changes in the value of shipments of industries that use a significant amount of natural gas, such as the bulk chemical or food industries. Although industrial fuel choices may change some, based on fuel prices, these Issue in Focus cases use the same macroeconomic and value of shipment assumptions as in the AEO2023 Reference case, Because NEMS includes little macroeconomic feedback, this assumption limits consumption changes in the manufacturing sector.
For all three LNG cases, we project U.S. energy-related carbon dioxide emissions in 2050 will be within 1% of the Reference case, largely because total domestic consumption in all sectors varies so little across these cases.
Appendix
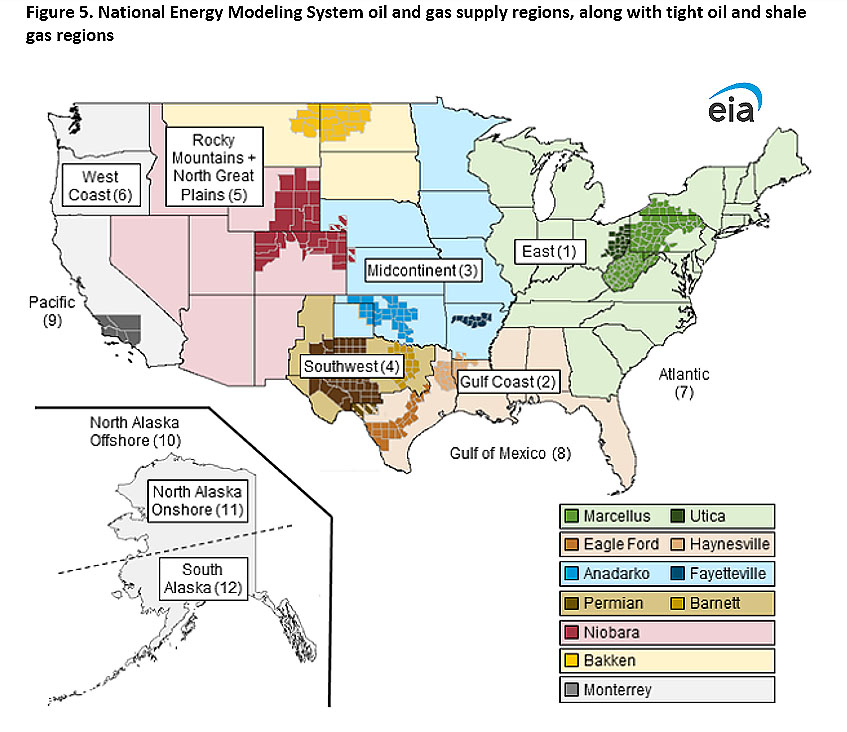
NEMS oil and natural gas supply regions and corresponding tight oil and shale gas regions
In the AEO2023, natural gas production and prices are ultimately passed to NEMS by oil and gas supply region. Of the 14 oil and gas supply regions, 7 are onshore, 3 are offshore, 3 are in Alaska, and 1 is the U.S. total (Figure 5).
Footnotes
- Dry natural gas is natural gas that remains after the liquefiable hydrocarbon portion has been removed from the natural gas stream (that is, natural gas after lease, field, or plant separation) and any volumes of nonhydrocarbon gases have been removed where they occur in sufficient quantity to render the gas unmarketable. Dry natural gas is also known as consumer-grade natural gas.
- In NEMS, LNG exports are largely based on differences of a simplified representation between the cost of supplying LNG and international LNG prices. In the real world, however, several simultaneous pricing mechanisms exist, such as trading based on spot prices, long-term oil-linked LNG contracts, and long-term Henry Hub-linked LNG contracts. For more information, see the Natural Gas Market Module Documentation.
- See Figure 3.6 in the Natural Gas Market Module Documentation for a more detailed explanation of the LNG demand curve.