
Energy Perspectives: United States energy imports decline while energy exports increase
Note: The United States imports small amounts of coal.
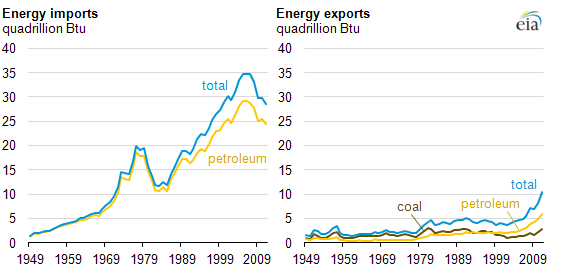
In 2011, the United States consumed more than 97 quadrillion Btu (quads) of energy, despite only producing about 78 quads. The difference—about 18 quads—reflects the balance of imports and exports of energy. Petroleum, which includes crude oil as well as petroleum products, accounted for a majority of both energy imports and exports.
The United States imported almost three times as much energy as it exported in 2011, a ratio that is much lower than the import peak in 2002, when energy imports were more than eight times energy exports. Imports have exceeded exports in every year since 1952.
Petroleum made up about 86% of energy imports in 2011. Canada supplied the largest share of these petroleum imports. The next biggest sources of U.S. petroleum imports in 2011 were Mexico, Saudi Arabia, Venezuela, and Nigeria, in that order. Overall, about 40% of U.S. petroleum imports came from countries in the Organization of the Petroleum Exporting Countries (OPEC), while 60% came from non-OPEC countries such as Canada, Mexico, Russia, and Brazil. Most of these petroleum imports were crude oil as opposed to petroleum products.
Besides petroleum, most of the remaining energy imports were natural gas (12%). All other fuel sources, including coal, coal coke, biofuels, and electricity, combined to account for about 2% of energy imports in 2011.
Petroleum also made up the bulk (57%) of U.S. energy exports in 2011. However, less than 2% of that exported petroleum was crude oil. Most of it was products derived from crude oil: petroleum products, unfinished oils, pentanes plus, and gasoline blending components, as the United States has some of the world's most advanced oil refineries.
Other energy exports include coal and coal coke (27%), natural gas (15%) and a small amount of biofuels and electricity (about 1%).
Time series for several energy production characteristics, along with details about data collection and conversion, are available in EIA's Annual Energy Review.
Tags: coal, exports/imports, liquid fuels, natural gas, oil/petroleum