Menu
Crude oil, gasoline, heating oil, diesel, propane, and other liquids including biofuels and natural gas liquids.
Exploration and reserves, storage, imports and exports, production, prices, sales.
Sales, revenue and prices, power plants, fuel use, stocks, generation, trade, demand & emissions.
Energy use in homes, commercial buildings, manufacturing, and transportation.
Reserves, production, prices, employment and productivity, distribution, stocks, imports and exports.
Includes hydropower, solar, wind, geothermal, biomass and ethanol.
Uranium fuel, nuclear reactors, generation, spent fuel.
Comprehensive data summaries, comparisons, analysis, and projections integrated across all energy sources.
Monthly and yearly energy forecasts, analysis of energy topics, financial analysis, congressional reports.
Financial market analysis and financial data for major energy companies.
Greenhouse gas data, voluntary reporting, electric power plant emissions.
Maps, tools, and resources related to energy disruptions and infrastructure.
State energy information, including overviews, rankings, data, and analyses.
Maps by energy source and topic, includes forecast maps.
International energy information, including overviews, rankings, data, and analyses.
Regional energy information including dashboards, maps, data, and analyses.
Tools to customize searches, view specific data sets, study detailed documentation, and access time-series data.
EIA's free and open data available as API, Excel add-in, bulk files, and widgets
Come test out some of the products still in development and let us know what you think!
EIA's open source code, available on GitHub.
Forms EIA uses to collect energy data including descriptions, links to survey instructions, and additional information.
Sign up for email subscriptions to receive messages about specific EIA products
Subscribe to feeds for updates on EIA products including Today in Energy and What's New.
Short, timely articles with graphics on energy, facts, issues, and trends.
Lesson plans, science fair experiments, field trips, teacher guide, and career corner.
EIA is continuing normal publication schedules and data collection until further notice.
In 2011, the United States produced about 78 quadrillion Btu (quads) of energy, more than at any point in the nation's history. More than three-quarters of this energy production came from nonrenewable fossil fuels: coal, natural gas, crude oil, and natural gas plant liquids. Despite rising production, the United States was a net energy importer, consuming more than 97 quads of energy in 2011.
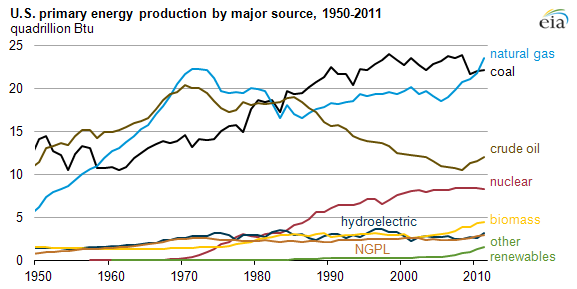
The 60.6 quads of domestic fossil fuel production set a record, exceeding the previous peak of 59.3 quads in 1998. Of those fuels, natural gas surpassed coal as the most-produced fuel with 23.5 quads compared to coal's 22.2 quads. Production of crude oil, which experienced a long decline from 20.4 quads in 1970 to 10.5 quads in 2008, rose to almost 12 quads in 2011. Natural gas plant liquids (NGPL), which are distinct from 'dry' natural gas, rose to their highest level of 2.9 quads.
Other fuels also experienced record production levels in 2011. Biomass, which includes wood and wood-derived fuels, biomass waste, and biomass inputs to the production of ethanol and biodiesel, increased to 4.5 quads. Other nonhydroelectric renewable energy increased to 1.6 quads, mostly from wind (1.2 quads), with the balance from geothermal and solar-photovoltaic.
The other fuel sources remained at their recent product levels: nuclear electric power contributed 8.3 quads, maintaining its position as the nation's largest nonfossil fuel energy source, and hydroelectric power contributed 3.2 quads.
Time series for several energy production characteristics, along with details about data collection and conversion, are available in EIA's Annual Energy Review.
Tags: biomass, coal, crude oil, liquid fuels, natural gas, nuclear, production/supply, renewables