
Average spot natural gas prices declined during the first half of 2012
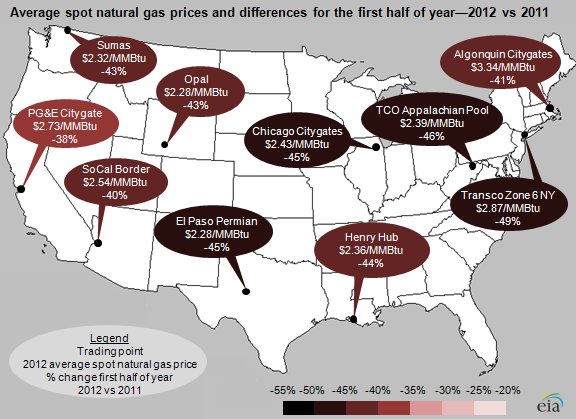
Note: Spot prices on the map reflect averages of daily prices from the first half of the year: January 1, 2012 to June 30, 2012. The percentage change reflects the average change in daily spot natural gas prices by trading point for the first half of 2012 compared to the first half of 2011.
Average spot natural gas prices in key regional markets, which reflect the wholesale price of natural gas at major trading points, declined about 38% to 49% during the first half (January 1 to June 30) of 2012 compared to the same period in 2011. Natural gas spot prices at the Henry Hub—a key benchmark and major trading location—averaged about $2.36 per million British thermal units (MMBtu) during the first half of 2012. Rising production, record end-of-winter storage inventories, and mild weather contributed to spot natural gas prices nearing their lowest levels in a decade until prices rebounded at most trading points to the high $2/MMBtu range by the end of June.
Specific factors contributing to lower average spot natural gas prices during the first half of 2012 include:
- Supply: U.S. dry natural gas production was about 5% higher during the first half of 2012 compared to the same period in 2011, according to Bentek Energy. This growth has been largely driven by gains in the Marcellus shale, where production nearly doubled from June 2011 to June 2012 and now comprises about 9% of total U.S. dry gas production. Increases in the Marcellus basin helped offset: slower growth or even modest declines in other gas supply areas, lower deliveries of liquefied natural gas (LNG), reduced net imports (imports minus exports) via pipelines from Canada, and increased natural gas exports to Mexico. Results through the first half of 2012 underscore the United States' declining dependence on imported natural gas.
- Consumption: Overall natural gas consumption was up just over 1% through the first half of this year, so U.S. natural gas supply rose faster than consumption. However, consumption by sector varied. Residential and commercial sector natural gas consumption was down 16% in the first half of 2012 because the mild winter reduced space heating needs. For example, U.S. population-weighted heating degree days were lower than normal in January (-18%), February (-13%) and March (-36%). But this decline in demand for heating was more than offset by demand from the power sector, where sustained low natural gas prices have resulted in a shift towards more natural gas-fired electric generation and demand was up 25% from the first half of 2011.
- Storage: The U.S. Lower 48 states had record natural gas storage inventories at the close of the winter 2011/2012 (November 2011 through March 2012). As a result, storage operators or their customers have not needed to buy as much natural gas to inject in preparation for the upcoming winter or to manage day-to-day imbalances, and this has contributed to lower natural gas prices. Last month, total U.S. natural gas storage inventories in the Lower 48 states topped three trillion cubic feet for the first time ever during June. As of August 3, storage inventories were 14% above the five-year average. The August 2012 Short-Term Energy Outlook forecasts that inventories by the end of October will exceed 3.9 trillion cubic feet, a record high.