Natural gas prices near 10-year low amid mild weather, higher supplies in winter 2011-12
Natural gas prices continued their downward trend this winter as a result of continued high production levels, mild weather limiting heating demand, and robust storage. On March 31—the end of what is considered winter for the natural gas market—spot natural gas prices at the Henry Hub approached $2 per million British thermal units (MMBtu). On April 18, the natural gas spot price at Henry Hub was $1.87/MMBtu. Storage levels were 2,479 billion cubic (Bcf) for the week ending March 30, more than 60% above the five-year average for that week. U.S. population-weighted heating degree days were 18% below normal from November through March, reducing estimated, average residential and commercial natural gas demand by over 6 billion cubic feet per day (Bcfd) compared to the previous five-year average.
Click on the tab headers below to see charts highlighting factors affecting natural gas prices.
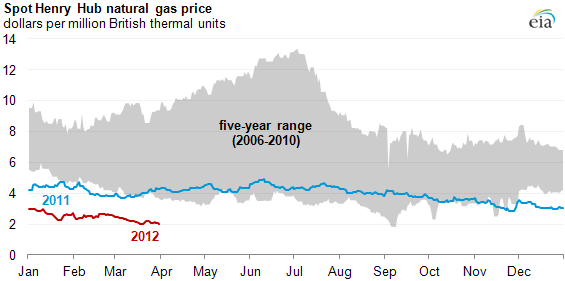
Spot natural gas prices near ten year lows during winter 2011-2012
Spot natural gas prices continued their downward trajectory this winter and remained below previous years' levels. Spot natural gas prices at the Henry Hub started 2012 below $3/MMBtu and declined to $2.02/MMBtu at the end of winter (March 31). The April natural gas futures contract settled on March 28th at $2.191/MMBtu, the lowest settlement price for the NYMEX natural gas futures contract in over 10 years. Current spot and NYMEX near-month natural gas futures prices are under $2/MMBtu, as of April 19, 2012.
Winter 2011-2012 was warmer than normal
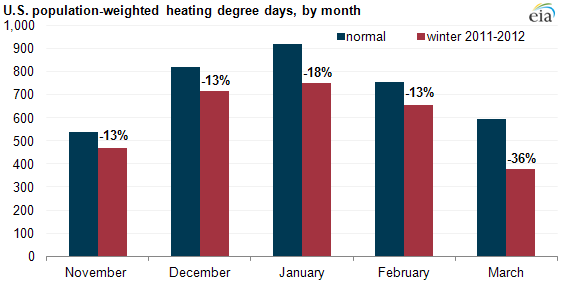
The winter of 2011-2012 was warmer than normal across most of the country—national population-weighted heating degree days (HDDs) were down between 13-36% relative to monthly historical normals from November through March (see chart). By region, every part of the country was warmer than normal for the winter except the Pacific region, which was just slightly (2%) cooler than normal. This relative lack of cold weather reduced natural gas demand and the need to pull natural gas from underground storage.
Warmer weather helped reduce regional price differences in the Northeast
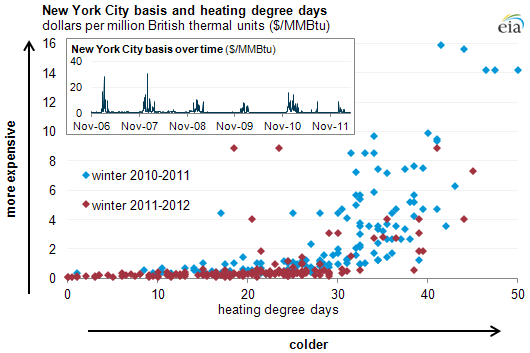
Note: The chart shows the daily spot natural gas price basis in New York City plotted against that days' weather. New York City is represented here as Transco Zone 6-New York. "Basis" is the difference between New York City's price and the price of natural gas as the Henry Hub near the Gulf of Mexico (e.g., if the price of natural gas is $7/MMBtu in New York City and $4/MMBtu at the Henry Hub, the New York City "basis" is $3/MMBtu for that day). Weather is defined here by heating degree days, which is the daily mean temperature's difference from a base temperature of 65 degrees Fahrenheit (e.g., a daily mean temperature of 40 degrees Fahrenheit would result in 25 heating degree days).
Typically in winter, cold weather increases natural gas demand and prices. This is most evident in the Northeast, where pipeline constraints can result in price spikes during periods of peak winter demand. This winter, cumulative heating degree days in New York City from November to March totaled 3,063, a decrease of 26% from the previous winter. Average NYC basis to the Henry Hub dropped as well, averaging $0.80/MMBtu this winter, down from an average $2.75/MMBtu last winter.
The charts above highlight, in part, the effects of mild weather on regional price differences. In the larger chart, the red dots represent the combination of weather (HDDs) and basis for winter 2011-2012. During winter 2010-2011, basis was high and weather was relatively cold—shown in the upper right-hand quadrant of the scatterplot. However, during the winter 2011-2012, basis was modest and weather was warmer, thus the red dots are located closer to the lower left portion of the scatterplot. The inset chart indicates that basis never rose above $10/MMBtu and had fewer price spikes compared to prior winters.
U.S. natural gas production flattening out, but still high to begin 2012
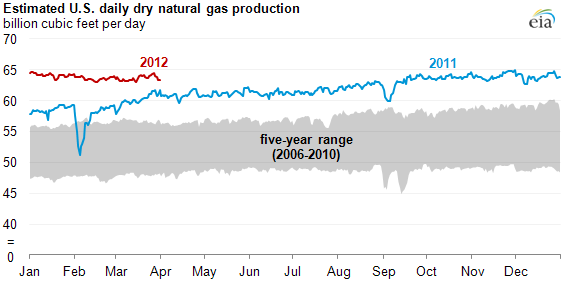
After a long period of steady growth, U.S. daily dry gas production growth leveled off during the first three months of 2012, averaging 63.8 Bcfd through March 31, a level almost 9% above the same period in 2011. Production from the Marcellus formation accounted for much of the year-over-year growth in dry natural gas production.
Natural gas demand was down, reflecting warmer-than-normal weather
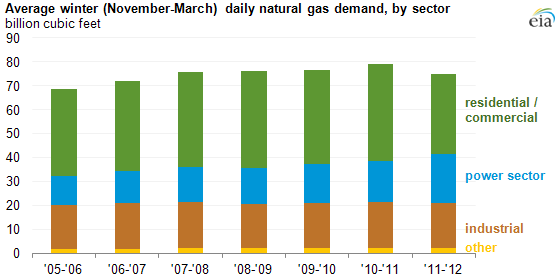
Note: Other includes estimates of losses associated with pipeline fuel and distribution use.
Natural gas demand averaged 75 Bcfd this winter, the lowest average winter demand since 2006-2007. Demand has been impacted greatly, and in different directions, by two factors in the market this winter.
- Mild weather. The widespread above-normal temperatures reduced natural gas demand from the residential/commercial sector, where natural gas is used largely to heat structures. Residential/commercial natural gas demand estimates averaged 33.4 Bcfd this winter, 22% below last year's winter demand and the lowest average demand using Bentek data beginning in 2005.
- Sustained, low natural gas prices. The drop in residential/commercial demand was balanced out to some degree by increased demand in the power sector. Sustained, low natural gas prices have increased the competitiveness of natural gas-fired electric generators relative to other generation units. This winter, natural gas demand from the power sector averaged 20.6 Bcfd, up 17% from last winter and almost double the average daily demand from the power sector during the winter of 2005-2006, according to Bentek.
Natural gas inventories far above historical ranges
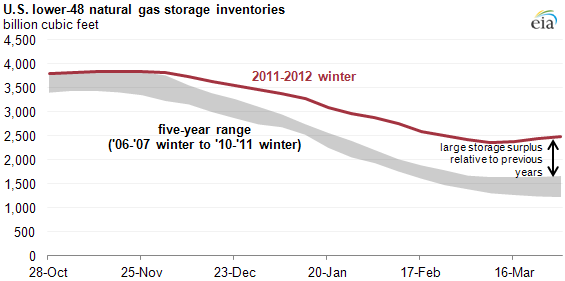
The combination of high natural gas production and lower heating degree days this winter reduced storage withdrawals. Storage inventories bottomed out this year at 2,369 Bcf for the week ending March 9, a record high for the winter low, and ended March at 2,479 Bcf, over 60% higher than the five-year average for the end of March. This winter also had only six weeks where cumulative storage withdrawals topped 100 Bcf, compared to a range of 9-12 weeks during each of the previous five winters.