Low U.S. injections reflect already high natural gas storage inventories
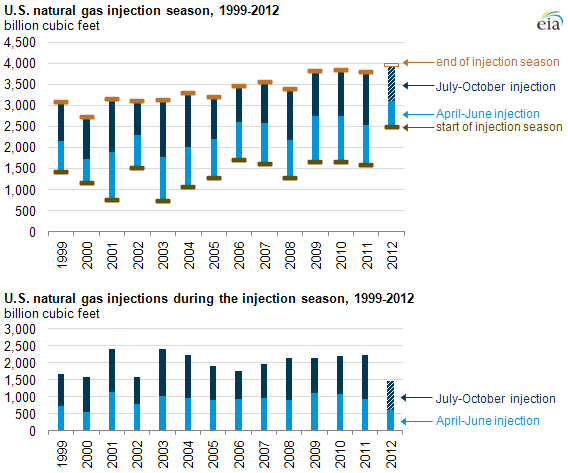
The increase in U.S. working natural gas inventories nearly half way through the 2012 injection season—the period from April through October when most natural gas is stored underground to help meet heating demand during the upcoming winter—was the lowest in 12 years. The slow start to the injection season reflects record-high inventories at the end of this winter, leaving less space to be filled, and a large increase in natural gas use by the U.S. electric sector for power generation. EIA estimates that, by November, working natural gas inventories will hit a record high, exceeding 3,900 billion cubic feet (Bcf). U.S. dry natural gas production was up almost 7% from January through May of 2012 compared to the same period in 2011, so natural gas injections have not shifted lower due to a downturn in domestic natural gas production.
The amount of working natural gas in underground storage increased 625 Bcf during April-June 2012, according to EIA's Weekly Natural Gas Storage Report. That is the smallest build since adding 564 Bcf, on a net basis, during the same period in 2000 (see chart above). While the increase in inventories is low, the amount of total gas in underground storage facilities is at a record high for this time of year, after topping 3,000 Bcf for the first time ever during any June month.
Natural gas inventories are expected to increase 1,477 Bcf during the 2012 injection season, the lowest since 1991, according to EIA's August Short-Term Energy Outlook. However, working gas inventories are forecast to be at a record high by November 1, 2012 of nearly 4,000 Bcf, close to total U.S. demonstrated peak working gas capacity.
Two main factors have contributed to the below-average increase in natural gas inventories:
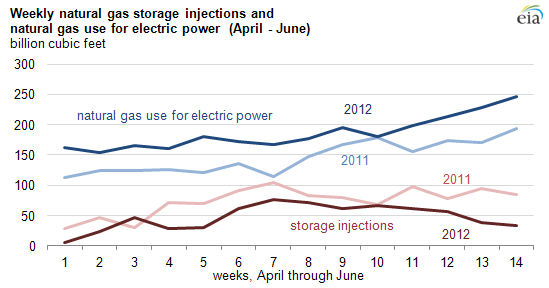
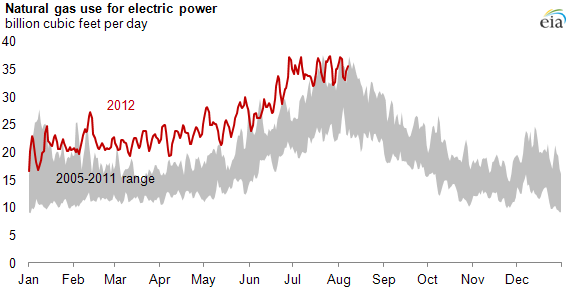
- Increased demand from the electric sector, with low-priced natural gas burn totaling about 2,600 Bcf from April through June of 2012, up 27% from just over 2,000 Bcf burned during the same period in 2011.
- Working gas in underground storage at the end of the 2011-2012 heating season stood at a record high because of above-normal winter temperatures, thus limiting the amount of gas that could be injected this year. Underground storage capacity is now about 75% full, a level not usually reached in recent years until late August or early September.
Tags: electricity, natural gas, production/supply, storage, weather