North American spot crude oil benchmarks likely diverging due to bottlenecks
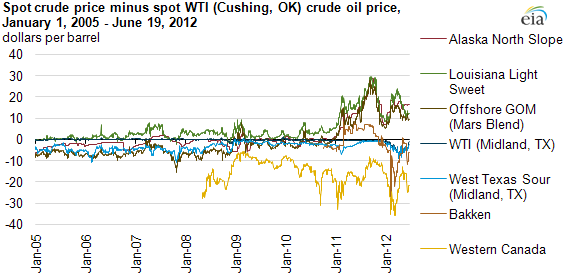
West Texas Intermediate at Cushing, Oklahoma (WTI Cushing), a light, sweet crude grade, is North America's most closely observed crude oil price benchmark and the underlying commodity of the NYMEX crude futures contract. Until 2008, all North American crude grades broadly tracked fluctuations in WTI Cushing prices and were clustered within about $8 per barrel of the WTI Cushing price. Pricing differences between crude grades were largely explained by the different quality characteristics of the crude oil in each location and transportation costs to Cushing, the delivery point of the NYMEX contract.
Since 2008, however, the price differences between WTI Cushing and other North American crude oil benchmarks have increased sharply (see chart above). In addition to WTI, other crude grades have emerged as alternative benchmarks. In particular, the Argus Sour Crude Price Index (ASCI), a weighted average of prices for several offshore Gulf of Mexico sour crude grades, has become the benchmark or reference used for assessing the price of several imported grades sold on a long-term contract basis, including Saudi Arabian and Kuwaiti crude grades.
Transportation constraints in the wake of rising production from inland fields in Canada, North Dakota, and Texas are one of the main drivers of the growing price discrepancy between crude grades since 2008. Limited pipeline capacity has made it difficult to bring crude oil out of the center of the continent, lowering all the affected benchmarks compared to prices outside the area. But within the constrained area, prices have also diverged from each other, reflecting local transmission bottlenecks within the larger constrained area. For example, crude oil benchmarks for the Bakken, Western Canada, and West Texas Sour (Midland, Texas) have traded at a discount to WTI Cushing. Rising production in the Bakken and West Texas have exacerbated these price differences. Outside the constrained areas, benchmarks like Louisiana Light Sweet, Alaska North Slope, and Mars Blend in the Gulf of Mexico reflect premiums to WTI Cushing, sometimes significant.
The phrase "transportation constraints" refers to a broad range of logistic issues, with inadequate pipeline capacity being the most common issue. However, EIA is not aware of any crude oil production capacity being shut in because of a lack of capacity to move the oil. In the short term, production surges and/or pipeline shutdowns force oil producers to compete with each other for more expensive transport options: rail and then truck. In the longer term, additional transportation capacity (rail and pipeline) is likely to be built, which should lower the cost of transporting the oil to markets.
Some North American crude oil benchmark locations are identified in the map below.
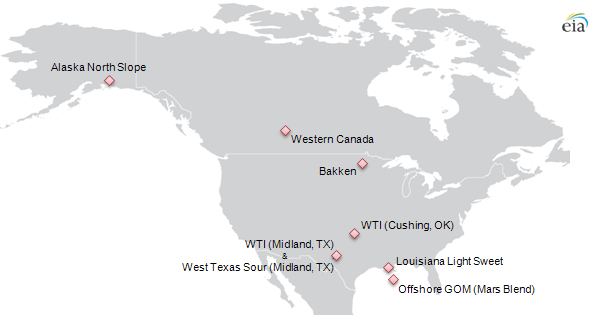
Notes: Locations on the map are based on the pricing point, not necessarily the area of production. Locations are approximate.