Virginia was the top net electricity recipient of any state in 2023
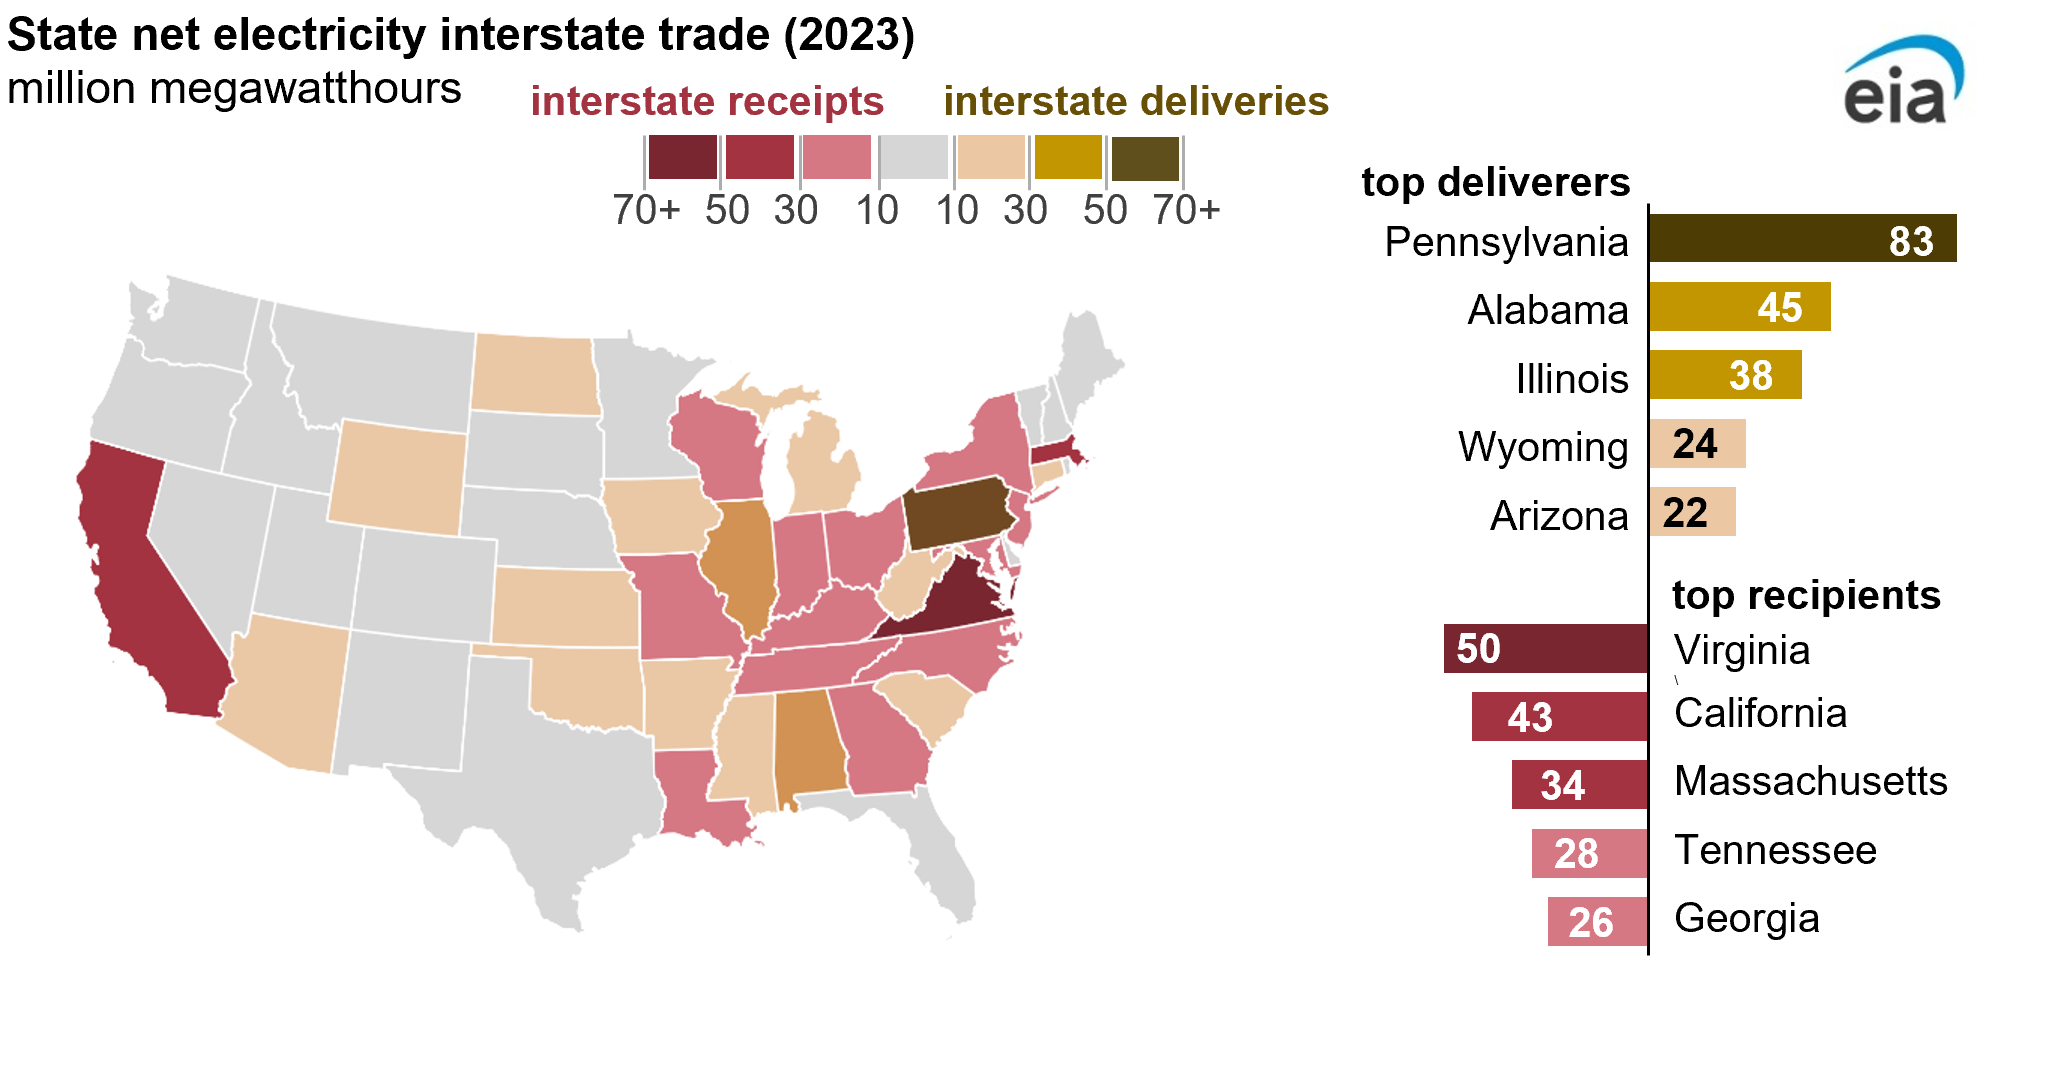
Electricity routinely flows among the Lower 48 states, with almost 10% of U.S. electricity generation traded across state lines. Generation of electricity exceeds its consumption in 25 states, and excess electricity is transmitted across state lines. In 2023, utilities in Virginia brought in the most electricity from other states, with 50.1 million megawatthours (MWh) in net electricity interstate receipts, or 36% of the state’s total electricity supply. Generators in Pennsylvania moved the most electricity outside state borders in 2023, with 83.4 million MWh of power shipped out, or 26% of generation in Pennsylvania.
States are not generally involved in the operation of the electric power systems and do not select which generators run at any given time. Rather, electrical systems called balancing authorities, which often span several states, are ultimately responsible for dispatching resources to meet demand and maintain a matching schedule for generation, demand, and interchange.
Our recently published State Electricity Profiles provide data on interstate and international electricity trade. We calculate interstate electricity trade by subtracting reported retail electricity sales, direct use, international exports, and estimated line losses from the electricity generated.
Pennsylvania, Alabama, and Illinois are top electricity-generating states
Generators in Pennsylvania, Alabama, and Illinois have produced more electricity than is consumed in their states for more than a decade. These states tend to have more capacity relative to their in-state sales or have a resource mix that makes more use of its capacity than in other states. More than 70% of electricity produced in these states comes from nuclear and natural gas plants.
Nuclear power plants operate at high-capacity factors and, as natural gas has become more cost competitive with coal, the capacity factors of those resources have increased. Twenty years ago, coal was the dominant fuel source in Pennsylvania and Alabama; today, the dominant source is natural gas, followed by nuclear. Electricity generation in Illinois was an almost even split between nuclear and coal 20 years ago; today, 55% of the electricity generated in the state comes from nuclear generation, with the rest coming from near equal portions of natural gas, coal, and wind.
More electricity is consumed in California and Virginia than is generated

For decades, utilities in California and Virginia have consumed more electricity than they produce. Electricity generation has increased in both states, but interstate receipts have generally increased in Virginia over the past five years while they have decreased in California. Between 2019 and 2023, electricity receipts by Virginia utilities increased by 61% (19.0 million MWh), while California utilities’ receipts declined by 39% (27.8 million MWh).
Interstate electricity receipts into Virginia have increased with growing commercial-sector demand, including from data centers. The decrease in California is due to a combination of increased rooftop and net-metered solar installations and investment in energy efficiency programs. Rooftop solar capacity in California is greater than in any other state, and more utility-scale solar farm capacity is located there than in any other state. For example, the 16.6 gigawatts (GW) of rooftop solar capacity in California exceeds the 15.0 GW of utility-scale solar farms in Texas.
In 2023, power companies in California lost their long-held position to those in Virigina as receiving the most electricity from other states. The 28.3 million MWh decrease in electricity receipts in 2023 in California was mainly due to a 5% (12.4 million MWh) decrease in electricity consumption and an 84% (14.7 million MWh) increase in hydroelectric generation from 2022.
Interstate trade in the Pacific Northwest is shifting
Utilities in Washington went from producing more electricity than customers consumed to receiving over 1.1 million MWh of electricity from other states, a one-year turnaround of 25.1 million MWh in 2023. The ongoing drought in Canada and Washington reduced hydroelectric generation for both regions. Utilities in Washington generated 22% (17.5 million MWh) less electricity in 2023 than in 2022.
Principal contributor: Marc Harnish
Tags: states, electricity, map, generation, consumption/demand, Pennsylvania, Alabama, Illinois, California