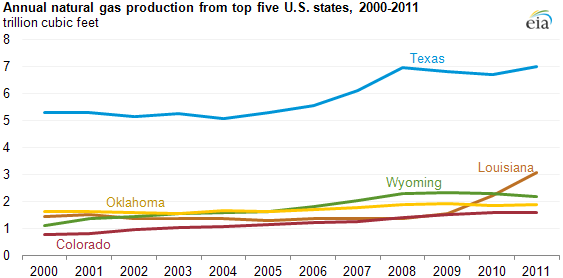
Top 5 producing states' combined marketed natural gas output rose in 2011
Note: 2011 production is preliminary data from EIA for all states, except Colorado, where preliminary data is provided by the state government.
Download CSV Data
Combined marketed natural gas production from the top five natural gas producing states—Texas, Louisiana, Wyoming, Oklahoma, and Colorado—increased by about 7.5% in 2011, although their share of total U.S. natural gas output fell slightly to about 65%.
Marketed natural gas production from these states in 2011 totaled 15.7 trillion cubic feet (Tcf), according to annual data from the U.S. Energy Information Administration. The drop in their combined share of total U.S. production reflects increased contributions from other states, particularly those in which operators significantly expanded development of shale gas formations. Shale gas production from states such as Pennsylvania helped boost overall U.S. natural gas output by almost 8% in 2011.
Due primarily to drilling programs in the Marcellus shale formation, Pennsylvania's marketed natural gas production in 2011 more than doubled to nearly 1.3 Tcf, according to preliminary estimates from Pennsylvania's Department of Environmental Protection. Arkansas has also seen strong growth in its marketed natural gas production, with output more than tripling since 2007 due mainly to increased production in the Fayetteville shale play.
Alaska is the country's second leading natural gas producer in terms of gross withdrawals, but most of the state's production is not brought to market, as production volumes far exceed local demand and there is insufficient pipeline capacity to transport the gas to distant markets. Most of Alaska's natural gas not brought to market is re-injected into existing oil fields to provide sufficient pressure to maintain oil production rates.
Highlights from the top marketed natural gas producing states in 2011:
- Texas. Natural gas production increased 4.5% from the year before to the highest level since 1980, due in part to growing output from the Eagle Ford shale formation where drillers who are aggressively pursuing high-value liquid hydrocarbons are also producing growing amounts of natural gas.
- Louisiana. Natural gas production increased 38% as the Haynesville shale gas formation in the northwest part of the state was one of the biggest shale gas producing plays in the United States.
- Wyoming. Natural gas production fell 5.6% to the lowest level since 2007, as lower natural gas prices made coalbed methane gas that accounts for almost two-thirds of the state's natural gas production less profitable because high-priced gas liquids aren't normally found in coal seams.
- Oklahoma. Natural gas production increased 3.9% to the second highest annual output since 1994 due to higher output in the Woodford shale play.
- Colorado. Natural gas production grew about 1.4% as output increased for the 25th year in a row to break another record output high. The Niobrara shale play in the northeast corner of the state helped raise Colorado's natural gas production.
Tags: Alaska, Arkansas, Colorado, Eagle Ford, Louisiana, Marcellus, natural gas, Oklahoma, Pennsylvania, production/supply, shale, states, Texas, Wyoming