U.S. rail carloads of coal in first quarter of 2012 lowest since 1994
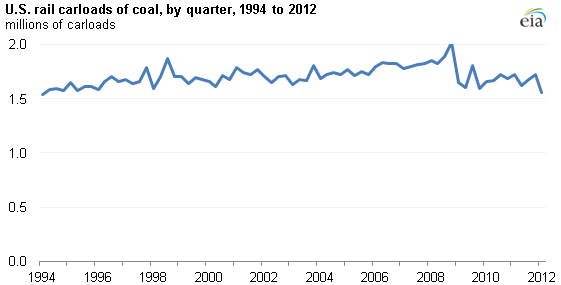
Note: These data exclude volumes from Canadian-owned railroad companies operating exclusively in the U.S. The number of shipping weeks varies by quarter. Most quarters have 13 weeks.
Total U.S. carloads of coal by rail during the first quarter of 2012 fell to 1.55 million carloads, the lowest level for any quarter since the beginning of 1994, as demand for coal by the U.S. electricity sector decreased (see chart). The power sector accounts for more than 90% of the coal consumed in the United States. Although carloads of coal via rail are down, the share of total coal deliveries that are made via rail has grown in recent years.
Over the same period, the share of U.S. coal transported by rail has been growing in recent years as demand for low-sulfur coal produced mainly in Wyoming's Powder River Basin increased. Over 70% of domestic coal was delivered by rail last year (calculated using data through the third quarter of 2011), up from around 65% a decade ago (see chart below). Rail is the most common method for transporting large volumes of western coal over long distances to power plants located in the eastern half of the United States.
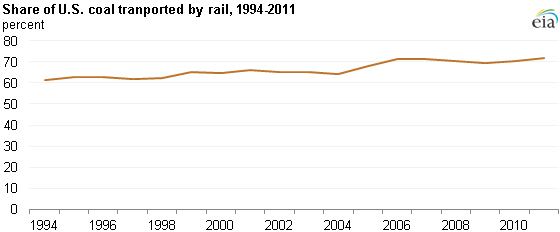
Note: 2011 data are preliminary and include Q1-Q3 only.
Coal-fired generation at U.S. power plants has decreased recently, reflecting both lower natural gas prices that have encouraged competition between natural gas and coal in the power sector and mild weather that has reduced the demand for electricity for space heating.
Tags: coal, electricity, transportation, United States