
First-quarter capital spending by public U.S. oil companies up, cash from operations down
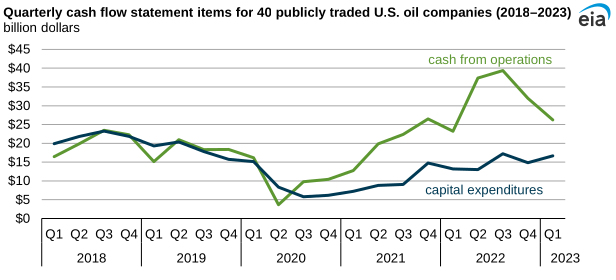
Note: Q=Quarter
Financial results for 40 publicly traded U.S. oil exploration and production (E&P) companies show capital expenditure in the first quarter of 2023 increased from the fourth quarter of 2022, even though cash from operations declined. Previously, rising crude oil prices in the first half of 2022 had driven increased production and had helped companies post multiyear highs for cash from operations. Capital expenditure growth had been much slower over the past two years.
In the first quarter of 2023, lower crude oil prices reduced cash from operations for these companies, which declined 18% ($5.8 billion) compared with the fourth quarter of 2022, to $26.2 billion. At the same time, capital expenditure in the first quarter of 2023 was 12% ($1.8 billion) higher compared with the previous quarter, totaling $16.7 billion. As a result, capital expenditure as a share of cash from operations increased to 64%, the highest percentage since the third quarter of 2020.
Capital expenditure made by E&P companies represents spending on property, plant, and equipment used for producing crude oil. Historically, when crude oil prices increase, companies increase their capital expenditure to increase crude oil production by deploying more drilling rigs. Changes in the number of oil rigs typically follow changes in oil prices, lagging by about four months.
Recent declines in crude oil prices and oil rig counts suggest that capital expenditure could decline in the coming quarters. West Texas Intermediate crude oil prices peaked at $108.45 per barrel (b) on average in the second quarter of 2022 before declining 31% to average $74.73/b in the first half of 2023. The oil-directed rig count peaked at 627 rigs at the beginning of December 2022 and has since declined by 16% (98 rigs) through the end of July 2023.
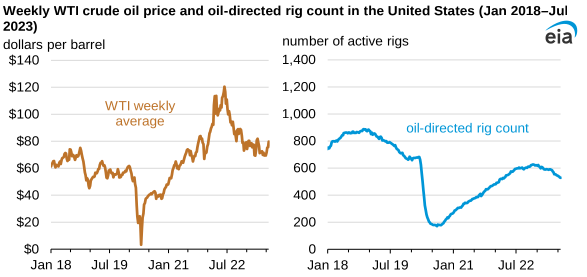
Note: WTI=West Texas Intermediate
We base our analysis on the published financial reports of 40 publicly traded oil companies that produce most of their crude oil in the United States. As a result, our observations do not represent the entire sector because we exclude private companies, which do not publish financial reports. These 40 publicly traded companies account for 32% of all crude oil produced in the United States in the first quarter of 2023, or about 4.0 million barrels per day.
Principal contributors: Alexander de Keyserling, Kimberly Peterson
Tags: prices, crude oil, quarterly, exploration, oil/petroleum