
U.S. gasoline inventories are rising, driven by East Coast market dynamics
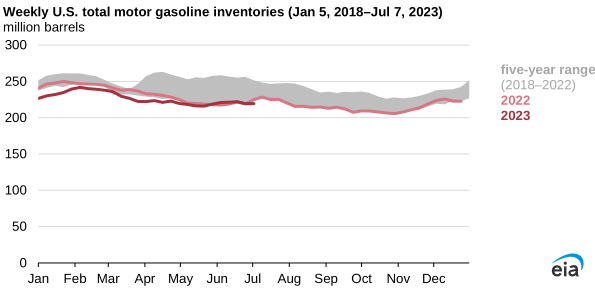
U.S. gasoline inventories have been rising following a low this year of 216 million barrels (8% below the previous five-year average) on May 26. East Coast (PADD 1) gasoline inventories account for most of the national inventory growth despite refinery unit outages that are limiting regional gasoline production. Relatively high gasoline prices on the East Coast and falling freight rates are driving U.S. imports from Europe, which is increasing regional inventories.
On the East Coast, where gasoline consumption is typically greater than in other regions of the country, gasoline inventories had been trending near or below the previous five-year range until the past few weeks, when inventories began building. On May 26, gasoline inventories in this region totaled 53.2 million barrels, or 15% less than the previous five-year average. After May 26, however, both U.S. and East Coast inventories increased. U.S. gasoline inventories increased by 3%, or 5.9 million barrels, reaching 222.0 million barrels on June 23, about the same as last year at the same time. East Coast gasoline inventories increased by 2.4 million barrels (5%) over the same period, reaching 55.7 million barrels, which is 2.3 million barrels (4%) more than at the same time last year. Both U.S. and East Coast inventories have fallen since June 23 but remain above their respective May 26 levels.
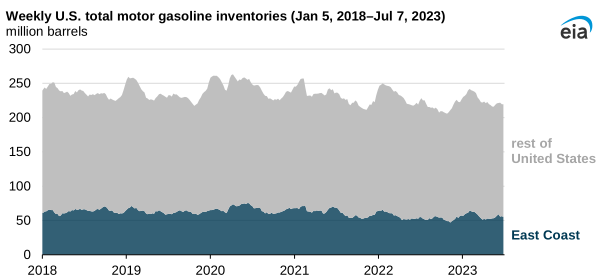
Gasoline inventories on the East Coast have increased despite refinery issues affecting gasoline production. At the Phillips 66 refinery in Bayway, New Jersey, the fluid catalytic cracker (FCC), primarily used for producing additional gasoline in refining, came offline, and the outage will reduce gasoline production by 100,000 barrels per day (b/d), according to trade press reports. Reports indicate that repairs to the FCC will be made over the next few weeks, and gasoline production should increase once the unit is back online.
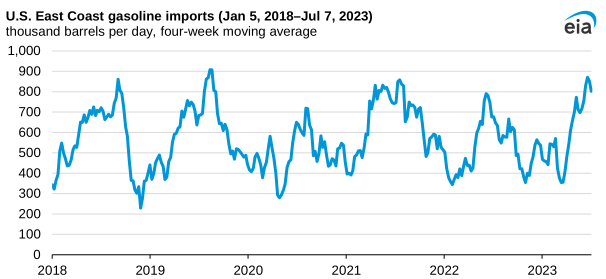
Our data indicate that gasoline imports into the U.S. East Coast have increased since March, which follows seasonal trends, and reached 823,000 b/d in June, the highest monthly average (based on the four-week moving average) since July 2019. The East Coast primarily receives its gasoline imports from Europe, which increased by 173,000 b/d between March and June, according to data from Vortexa Analytics. In addition to the relatively high gasoline prices on the East Coast, lower shipping rates are also supporting gasoline imports.
Principal contributor: Matthew French