Menu
Crude oil, gasoline, heating oil, diesel, propane, and other liquids including biofuels and natural gas liquids.
Exploration and reserves, storage, imports and exports, production, prices, sales.
Sales, revenue and prices, power plants, fuel use, stocks, generation, trade, demand & emissions.
Energy use in homes, commercial buildings, manufacturing, and transportation.
Reserves, production, prices, employment and productivity, distribution, stocks, imports and exports.
Includes hydropower, solar, wind, geothermal, biomass and ethanol.
Uranium fuel, nuclear reactors, generation, spent fuel.
Comprehensive data summaries, comparisons, analysis, and projections integrated across all energy sources.
Monthly and yearly energy forecasts, analysis of energy topics, financial analysis, congressional reports.
Financial market analysis and financial data for major energy companies.
Greenhouse gas data, voluntary reporting, electric power plant emissions.
Maps, tools, and resources related to energy disruptions and infrastructure.
State energy information, including overviews, rankings, data, and analyses.
Maps by energy source and topic, includes forecast maps.
International energy information, including overviews, rankings, data, and analyses.
Regional energy information including dashboards, maps, data, and analyses.
Tools to customize searches, view specific data sets, study detailed documentation, and access time-series data.
EIA's free and open data available as API, Excel add-in, bulk files, and widgets
Come test out some of the products still in development and let us know what you think!
EIA's open source code, available on GitHub.
Forms EIA uses to collect energy data including descriptions, links to survey instructions, and additional information.
Sign up for email subscriptions to receive messages about specific EIA products
Subscribe to feeds for updates on EIA products including Today in Energy and What's New.
Short, timely articles with graphics on energy, facts, issues, and trends.
Lesson plans, science fair experiments, field trips, teacher guide, and career corner.
EIA is continuing normal publication schedules and data collection until further notice.
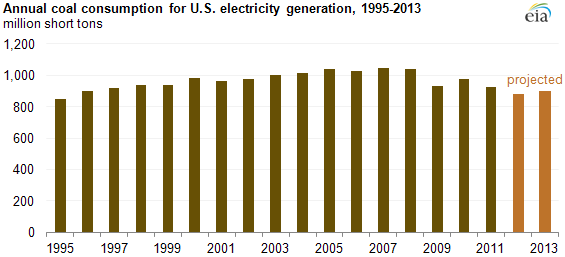
Coal consumption by the U.S. electric power sector in 2012 is expected to fall below 900 million short tons for the first time since 1996 as the electric industry increased its use of natural gas for power generation, EIA projected in its March Short-Term Energy Outlook.
Coal demand by the power sector is projected to decline by nearly 5% this year to about 884 million short tons, the lowest level since 1995. The decline in coal consumption reflects, in part, the continued switch by the electric industry to natural gas. Power sector demand for natural gas is expected to grow by almost 9% this year to a record high of 22.7 billion cubic feet per day. Coal use by the power sector is projected to rise slightly in 2013 but remain below the 2011 level.
As a result, the share of U.S. power generation fueled by natural gas is projected to rise from 24.8% in 2011 to 27.1% this year. Conversely, the share of electricity generation from coal is projected to drop from 42.2% to 40.4%.
These projections include the prices of natural gas and coal, as well as assumptions about temperatures, that are key drivers in the need for electric generation. If prices or temperatures differ significantly from those included in the projections, then the amount of electricity generated by coal and natural gas would likely be different from the projections shown in the STEO forecasts.
The power sector consumes about 92% of U.S. coal production. Other large users of coal are coking plants involved in the steelmaking process and industrial users such as cement and paper manufacturers.
Tags: coal, consumption/demand, electricity, generation, natural gas, prices, production/supply, STEO (Short-Term Energy Outlook), weather