
EIA provides new breakout of natural gas storage inventories in the Producing Region
Note: A small amount of salt cavern storage capacity is located outside the Producing Region. EIA cannot disclose weekly inventory change estimates for these facilities without violating confidential reporting requirements.
Download CSV Data
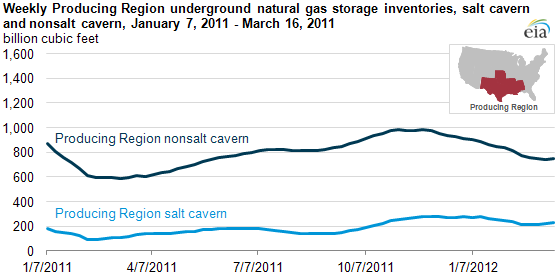
Starting with the March 22, 2012 edition of the Weekly Natural Gas Storage Report, EIA will provide new breakouts of inventory levels at salt cavern and nonsalt cavern facilities for the weekly estimates of working gas in underground natural gas storage inventories in the Producing Region, defined as Alabama, Arkansas, Kansas, Louisiana, Mississippi, New Mexico, Oklahoma, and Texas. This new breakout of regional natural gas stocks should help analysts assess more comprehensively the relationship between inventory changes and types of storage facilities. As of March 16, 2012, nonsalt cavern inventories were about 752 billion cubic feet or about three times higher than inventories in salt facilities in the Producing Region. EIA currently is providing historical data for this breakout back to January 2011 and plans to provide more historical data in the future.
Because salt cavern and nonsalt cavern facilities—aquifer and depleted field reservoirs—have different operational characteristics, reporting weekly information for both in the Producing region will provide a more complete picture of natural gas trends. For example, salt cavern facilities can usually provide high deliverability, which means the ability to quickly inject or withdraw significant quantities of natural gas multiple times a year. Therefore, they generally offer greater operational flexibility than aquifers and depleted fields.
Nonsalt facilities account for most of the capacity in the Producing Region, but typically they provide seasonal service in which customers mostly inject natural gas from April through October and then withdraw stored natural gas during the winter (November through March). Some providers of nonsalt storage services require their customers (sometimes referred to as shippers) to reduce the quantity of natural gas they have in storage to certain levels, or "ratchets," at the end of the storage withdrawal season to maintain integrity of the fields. This requirement to reduce storage levels is generally not applicable to salt facilities, so reporting separately on each type of cavern storage could shed light on the Producing Region natural gas market as the winter of 2011-2012 winds down.
Beginning on March 22, 2012, with the report period for the week ending March 16, 2012, EIA is including salt and nonsalt facility totals for the Producing Region in the "Summary" section of the Weekly Natural Gas Storage Report.
Tags: Arkansas, natural gas, states, storage