
Natural gas imports from Canada continue providing winter reliability to U.S. markets
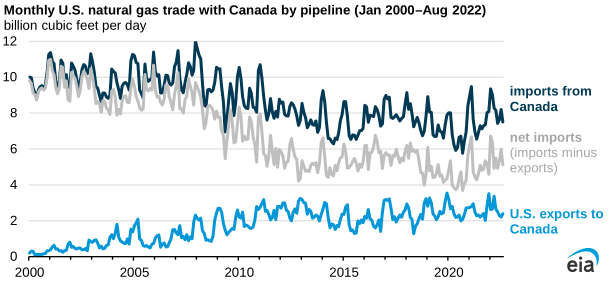
Despite the downward trend in natural gas imports from Canada, trade between the United States and Canada remains important in balancing U.S. natural gas markets and helps ensure reliable supply to parts of the United States. Because of ample capacity on pipelines and in storage facilities in Canada, suppliers can rapidly increase flows, which helps to stabilize the U.S. market during periods of supply and demand imbalance, such as during cold winter months.
In 2005, 17% of total U.S. supply of dry natural gas was imported from Canada. Since then, Canada’s share of imported dry natural gas supply to the United States has declined because U.S. domestic natural gas production has grown. As of the end of August, gross imports of dry natural gas from Canada accounted for, on average, 8% of U.S. supply, and U.S. natural gas production averaged 92%, or 97.0 billion cubic feet per day (Bcf/d), according to our Natural Gas Monthly.
During the same time period, U.S. pipeline exports of natural gas to Canada have increased. In 2000, U.S. exports averaged 2% of all pipeline natural gas trade with Canada. In 2005, that share increased to 9%. Through August of this year, it averaged 24%.
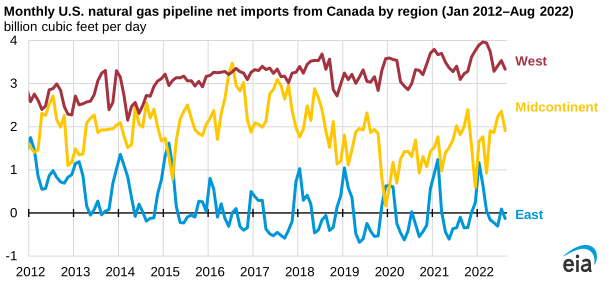
Natural gas imports from Canada to the western United States have provided a steady source of supply and have been increasing. So far this year, they have increased 4.1% compared with the same period in 2021. The border-crossing points at Sumas, Washington, and Eastport, Idaho, principally supply metropolitan areas in the Pacific Northwest and California, where several factors have challenged supply and demand balances this year:
- More demand for electric power to run air-conditioning due to sustained high temperatures and an extreme heat wave this summer
- Less hydroelectric power generation due to drought
- Reduced natural gas inflows from the Permian Basin due to pipeline constraints
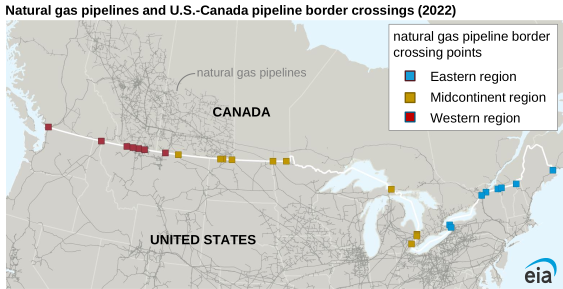
Natural gas pipeline capacity has expanded throughout the eastern United States, and the region is typically a net exporter of natural gas to Canada for much of the year. Imports from Canada, however, help support annual seasonal fluctuations in consumption, particularly during the winter peak in the United States, when cold temperatures drive demand for heating. Since 2012, imports into the eastern United States have generally peaked in January or February at approximately 2 Bcf/d and then again in July or August at approximately 1 Bcf/d, when high temperatures drive demand for air-conditioning. During the shoulder seasons (spring and fall), net flows of natural gas reverse, flowing into Canada to build inventories.
During Winter Storm Uri in February 2021, U.S. natural gas production had record declines, and imports from Canada increased to 9.5 Bcf/d to meet U.S. demand, the highest monthly average since February 2011.
Principal contributor: James Easton