|
Download Data (XLS File) |
|
||||||||
|
||||||||
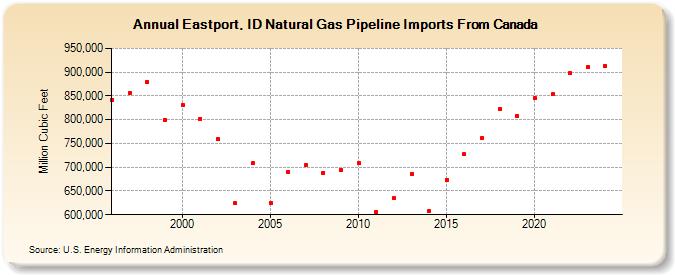
| Eastport, ID Natural Gas Pipeline Imports From Canada (Million Cubic Feet) | ||||||||
| Decade | Year-0 | Year-1 | Year-2 | Year-3 | Year-4 | Year-5 | Year-6 | Year-7 | Year-8 | Year-9 |
|---|---|---|---|---|---|---|---|---|---|---|
| 1990's | 842,114 | 856,503 | 879,840 | 800,345 | ||||||
| 2000's | 830,351 | 802,182 | 759,647 | 623,652 | 707,885 | 624,468 | 690,781 | 704,429 | 688,782 | 693,892 |
| 2010's | 708,806 | 606,099 | 634,194 | 686,449 | 608,147 | 673,531 | 726,750 | 760,451 | 822,535 | 808,167 |
| 2020's | 845,341 | 853,299 | 897,492 | 911,014 | 912,732 | 951,682 |
| - = No Data Reported; -- = Not Applicable; NA = Not Available; W = Withheld to avoid disclosure of individual company data. |
| Release Date: 6/30/2026 |
| Next Release Date: 7/31/2026 |