
March 14, 2012
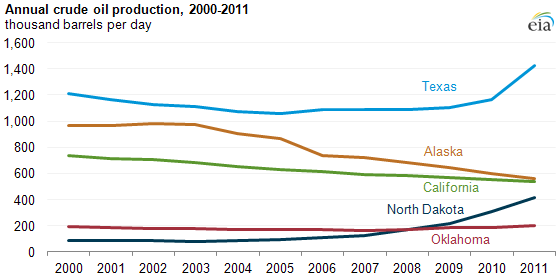
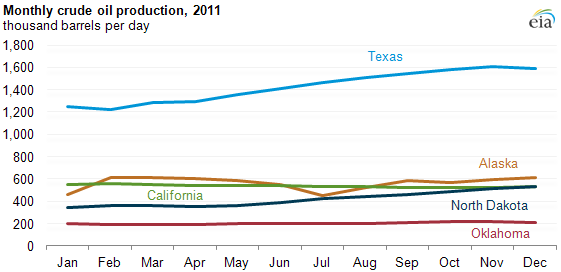
Five states accounted for about 56% of total U.S. crude oil production in 2011
Source: U.S. Energy Information Administration, Petroleum Supply Monthly.
Note: Production data includes crude oil and lease condensate.
Download CSV Data
Note: Production data includes crude oil and lease condensate.
Download CSV Data
Combined oil production (crude oil and lease condensate) from the top five U.S. oil-producing states increased during 2011 (see chart above). The biggest gains were in North Dakota and Texas, due in large part to increased horizontal drilling and hydraulic fracturing activity. Texas, Alaska, California, North Dakota, and Oklahoma accounted for about 56% of U.S. oil production last year, according to EIA's February Petroleum Supply Monthly report.
Highlights from the top oil-producing states in 2011 included:
- Texas. The Eagle Ford shale formation in south Texas contributed to gains in the state's oil production, which averaged 1,425 thousand barrels per day (bbl/d), the highest level since 1997.
- Alaska. Oil production fell for the ninth year in row, averaging 563 thousand bbl/d.
- California. Oil production averaged 535 thousand bbl/d, the lowest level in at least three decades.
- North Dakota. Preliminary data indicate increasing oil production from the Bakken formation pushed North Dakota ahead of California in December as the third biggest oil-producing state. North Dakota's oil production averaged 535 thousand bbl/d in December 2011 and 419 thousand bbl/d for the year.
- Oklahoma. Oil production averaged 204 thousand bbl/d during 2011, topping 200 thousand bbl/d for the first time since 1998.
Source: U.S. Energy Information Administration, Petroleum Supply Monthly.
Note: Production data includes crude oil and lease condensate.
Download CSV Data
Note: Production data includes crude oil and lease condensate.
Download CSV Data
Tags: Alaska, Bakken, California, crude oil, liquid fuels, North Dakota, oil/petroleum, Oklahoma, production/supply, shale, states, Texas