
Pre-Labor Day retail gasoline prices are the highest in the United States since 2014
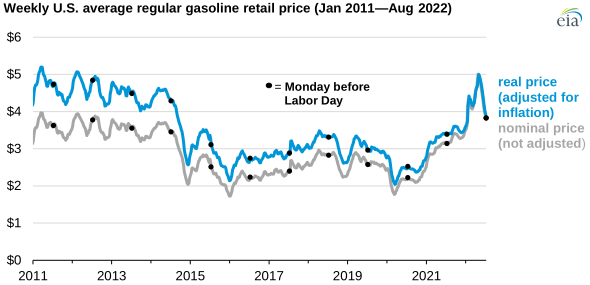
Note: Weekly data reflect U.S. average regular gasoline retail price for all formulations. Inflation-adjusted price is calculated using Consumer Price Index from BLS.
On the Monday before the Labor Day weekend, August 29, 2022, the retail price of regular gasoline averaged $3.83 per gallon (gal) across the United States, $0.69/gal (22%) higher than at the same time last year. After peaking on June 13, the retail gasoline price has fallen every week and is $1.18/gal lower than the peak June price, according to our Gasoline and Diesel Fuel Update.
Responses to the COVID-19 pandemic in 2020 substantially reduced vehicle travel and gasoline demand, particularly in the summer of 2020. Less crude oil production combined with increasing demand led to rising crude oil and gasoline prices during 2021. In February 2022, Russia’s full-scale invasion of Ukraine contributed to additional gasoline price increases. U.S. and European sanctions on exports from Russia reduced the global availability of petroleum products, such as motor gasoline and diesel fuel.
U.S. gasoline prices vary regionally to reflect:
- Local supply and demand conditions
- Differences in state fuel specifications
- State and local fuel taxes
Retail gasoline prices varied by region on August 29, the most recent EIA data available, but all prices were higher than in the same week of 2021:
- West Coast prices were $4.78/gal ($0.85/gal higher).
- Rocky Mountain prices were $4.02/gal ($0.37/gal higher).
- East Coast prices were $3.72/gal ($0.70/gal higher).
- Midwest prices were $3.68/gal ($0.70/gal higher).
- Gulf Coast prices were $3.36/gal ($0.58/gal higher).
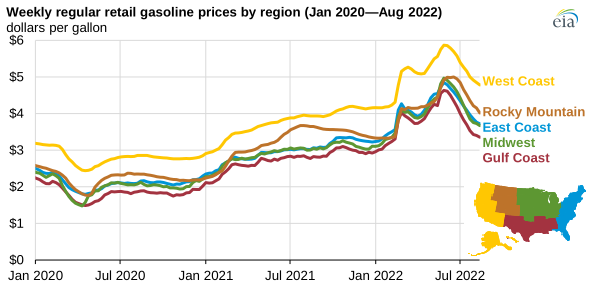
Gasoline prices vary in different regions of the United States. Prices are usually the highest on the West Coast due to limited connections with other major refining centers. The Gulf Coast produces more gasoline than it consumes; the region accounted for 54% of U.S. refining capacity in January 2022. In the Midwest, a refinery fire on August 29 at the largest refinery in the region—BP’s refinery in Whiting, Indiana, which can produce 435,000 barrels per day—has taken several of the facility’s units offline. This shutdown may contribute to an increase in gasoline prices in the Midwest.
The East Coast is the largest gasoline demand market in the United States, but it has relatively little refinery capacity. The region relies on gasoline from the Gulf Coast and imports from other countries to meet its consumption needs. The East Coast received more than 80% of all U.S. gasoline imports in 2021. Imports have been lower so far this year, which has led to a greater need on the East Coast for gasoline from the Gulf Coast.
Principal contributor: Kevin Hack
Tags: prices, gasoline, liquid fuels