EIA Product Highlight: Natural Gas Storage Dashboard
Our Natural Gas Storage Dashboard provides daily and weekly contextual information to the Weekly Natural Gas Storage Report (WNGSR), which contains our latest weekly natural gas storage estimates. The dashboard shows storage activity in several regions of the Lower 48 states and key market fundamentals that affect underground natural gas storage activity.
We update the dashboard in the mid-afternoon on the same day we release the WNGSR, which is usually on Thursday. The dashboard follows the WNGSR holiday reporting schedule.
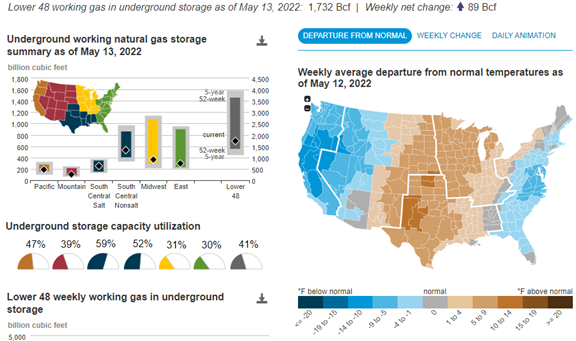
The dashboard includes natural gas storage inventories, net inventory changes, and utilization indicators for the Lower 48 states and different U.S. regions. Other metrics include temperature visualizations, estimated natural gas consumption by sector, net exports, the relationship between near-month natural gas futures prices, and the difference between current Lower 48 inventories and the most recent five-year average.
Information sources reflect a combination of our data and third-party data. Key sources of non-EIA data include temperatures from the National Oceanic and Atmospheric Administration (NOAA), natural gas demand and import/export data from IHS Markit, and 12-month natural gas futures strips from CME Group and Bloomberg.
A commentary section of the dashboard provides analysis of recent natural gas storage-related market conditions. These entries focus on many aspects of the natural gas storage market, such as potential drivers of changes in storage inventories, occasional details on EIA-derived storage statistics, and trends in natural gas storage infrastructure.
Principal contributor: EIA Staff
Tags: storage, natural gas