
U.S. natural gas prices spiked in February 2021, then generally increased through October
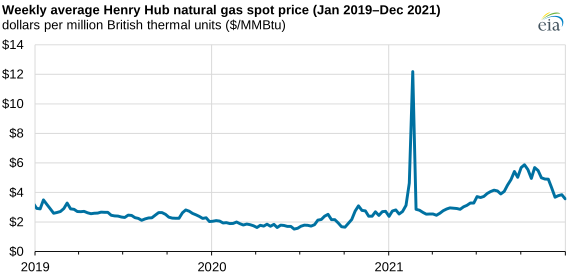
The wholesale spot price for natural gas at the Henry Hub in Louisiana (the U.S. benchmark for natural gas prices) averaged $3.89 per million British thermal units (MMBtu) in 2021, almost doubling from the 2020 average, according to data from Refinitiv.
U.S. natural gas prices briefly spiked in February during a winter storm that strained natural gas and electricity markets in Texas and Oklahoma. Prices then increased through October as economic recovery contributed to overall growth in natural gas demand, which outpaced growth in natural gas supply. At the same time, inventories were low after the February winter storm. Henry Hub spot prices then declined in the final months of the year because winter weather was relatively mild.
Daily natural gas spot and futures prices were volatile in 2021. Many factors contributed to price volatility, including weather-related consumption and production outages, high international natural gas prices that encouraged exports, key pipeline outages, the prices and availability of substitute fuels for power generation, summer storage injection needs, and the pace of growing natural gas production.
In mid-February, an intense winter storm in the central United States both increased energy consumption and disrupted energy supply. Daily dry natural gas production in Texas fell by almost half on Wednesday, February 17, according to estimates from IHS Markit, mostly because of well freeze-offs, which occur when water in the raw natural gas stream freezes.
The Henry Hub spot price of natural gas increased to nearly $24/MMBtu on February 17, the highest daily price (in real, inflation-adjusted terms) since February 2003. According to Natural Gas Intelligence data, many natural gas pricing hubs throughout the country also saw record-high prices around that time.
U.S. natural gas prices steadily increased from March through early October because of tighter supply and demand balances and low inventories. Historically low coal inventories at power plants may have limited the use of coal in the electric power sector in summer and early fall, which in turn could have put upward pressure on natural gas prices. High natural gas prices in global markets also encouraged more exports of natural gas. The United States exported 30% more natural gas during the first 10 months of 2021 than during the same period in 2020.
We estimate that 2021 was a record production year for natural gas in the United States, based on data through October and estimates for November and December. Production increased in natural gas-rich formations such as the Haynesville region (mainly in Texas and Louisiana) and the Appalachia Basin (mainly in Pennsylvania and West Virginia), according to our Drilling Productivity Report.
The U.S. residential and commercial sectors also consumed relatively less natural gas during final three months of 2021 because of mild winter weather. Less natural gas was needed for heating, allowing natural gas inventories to increase above their previous five-year average (2016–2020) in mid-December. This increase ended a 34-week period of below-average inventory levels that had begun in April, according to our Weekly Natural Gas Storage Report.
Principal contributor: Owen Comstock
Tags: prices, natural gas, spot prices, Henry Hub