
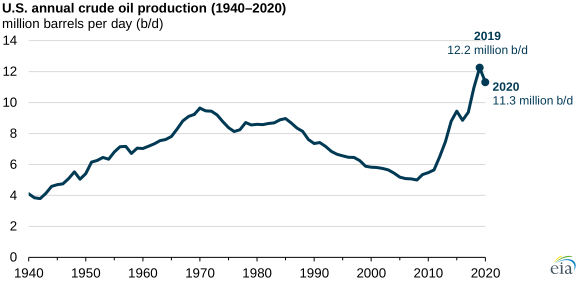
U.S. crude oil production fell by 8% in 2020, the largest annual decrease on record
From December 20 through December 30, Today in Energy will feature some of our favorite articles from 2021. Today’s article was originally published on March 9.
U.S. crude oil production averaged 11.3 million barrels per day (b/d) in 2020, down 935,000 b/d (8%) from the record annual average high of 12.2 million b/d in 2019. The 2020 decrease in production was the largest annual decline in the U.S. Energy Information Administration’s records. The production decline resulted from reduced drilling activity related to low oil prices in 2020.
In January 2020, U.S. crude oil production reached a peak of 12.8 million b/d. In March 2020, crude oil prices decreased because of the sudden drop in petroleum demand that resulted from the global response to the coronavirus (COVID-19) pandemic. The declining prices led crude oil operators to shut in wells and limit the number of wells brought online, lowering the output for the major oil-producing regions. In May, U.S. crude oil production reached its lowest average monthly volume for the year at 10.0 million b/d.
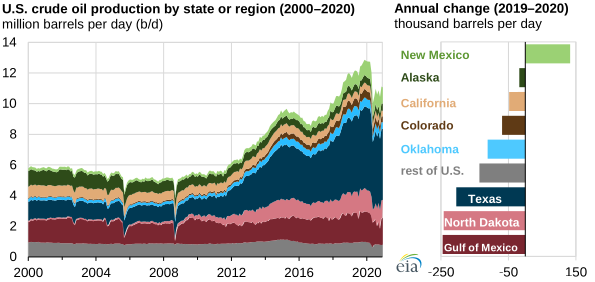
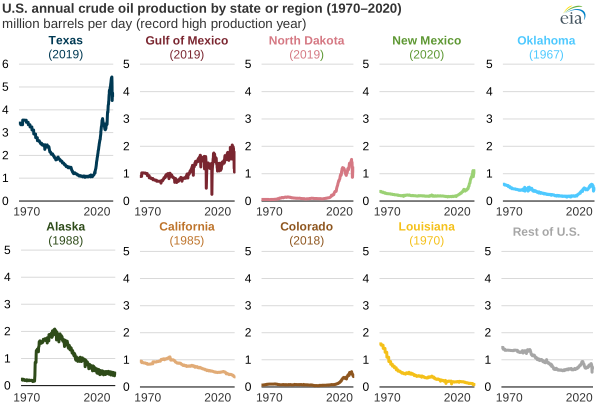
In 2020, more crude oil was produced in Texas than in any other state or region of the United States, accounting for 43% of the national total. Crude oil production in Texas averaged 4.87 million b/d in 2020, a decrease of 205,000 b/d (4%) from the record high of 5.07 million b/d set in 2019.
The Federal Offshore Gulf of Mexico saw the largest decrease in crude oil production, falling by 245,000 b/d (13%) to an annual average of 1.65 million b/d in 2020. Several hurricanes and tropical storms struck the Gulf of Mexico last year, causing operators to evacuate platforms and shut in production. North Dakota had the second-largest decrease at 242,000 b/d (17%) to an annual average of 1.18 million b/d. Oklahoma had the largest percentage decrease at 19%, falling to an annual average of 469,000 b/d.
The largest statewide increase in crude oil production in 2020 was in New Mexico, where it increased by 133,000 b/d (15%) to a record annual average high of 1.04 million b/d. The growth in New Mexico came from the Permian Basin, which spans parts of western Texas and eastern New Mexico.
Principal contributor: Emily Geary