
North Dakota’s natural gas producers meet the state’s natural gas capture target
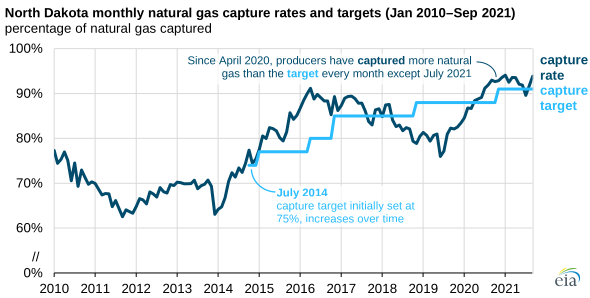
In North Dakota, the rate of natural gas flaring (which is natural gas burned at the wellhead of the production site rather than being captured) declined to an average of 7.5% this year through September. This decline in natural gas flaring resulted in producers capturing 92.5% of produced natural gas, which meets the state’s goal to capture 91% of the natural gas produced in the state. In early 2020, natural gas production fell rapidly as a result of COVID-19-related impacts, from 3.2 billion cubic feet per day (Bcf/d) in March to 1.9 Bcf/d in May, but returned to pre-pandemic levels almost as rapidly, reaching 2.9 Bcf/d by October of the same year. From April 2020 to September 2021, producers met the state capture target for every month except July 2021.
In July 2014, the North Dakota Industrial Commission adopted natural gas capture targets in response to increased natural gas flaring in the state’s Bakken and Three Forks formations. The rapid development of hydrocarbon resources in North Dakota, especially crude oil, over the past decade has outpaced the ability of regional infrastructure to process and transport associated natural gas from crude oil production. Flared natural gas produced from oil wells increased as a result of inadequate gathering and processing infrastructure. In 2013, the year before natural gas capture targets took effect, more than 30% of the natural gas produced in North Dakota was flared.
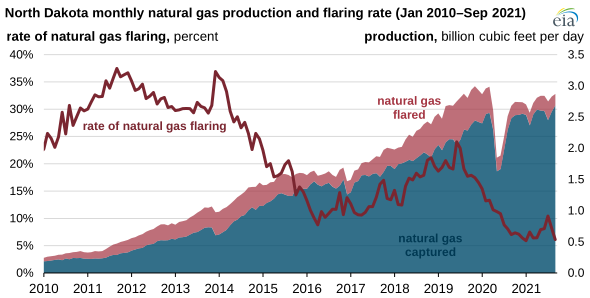
Meeting the capture targets required a buildout of natural gas gathering lines to transport natural gas from wells to processing plants and a buildout of the processing plants that remove impurities and heavier hydrocarbons from the natural gas. The North Dakota Industrial Commission reports that natural gas processing capacity in the state increased from 1 Bcf/d in 2013 to 3.4 Bcf/d in 2020, and they expect it to exceed 4.0 Bcf/d by the end of 2021.
Expanded pipeline capacity to move natural gas plant liquids (NGPLs) out of the state has further improved North Dakota’s midstream infrastructure. NGPLs must be separated from the raw natural gas before the natural gas can enter interstate pipelines. This process requires a dedicated pipeline network that moves the mixed NGPLs to fractionation plants where the mix is separated into its individual components, such as ethane and propane.
Without an outlet for NGPLs, natural gas processing plants cannot process raw natural gas. According to our Liquids Pipeline Projects Database, the pipeline capacity to move NGPLs out of the North Dakota production region increased from 60,000 barrels per day (b/d) in 2013 to more than 580,000 b/d as of September 2021.
Principal contributor: Warren Wilczewski
Tags: production/supply, natural gas, states, North Dakota