
North Dakota sees increases in real GDP per capita following Bakken production
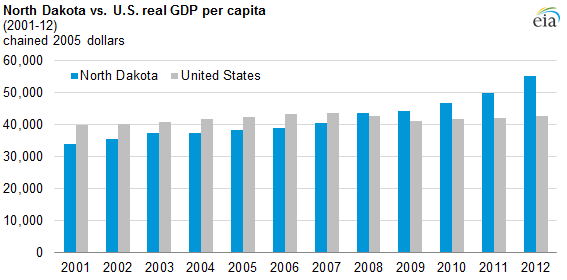
In recent years, North Dakota has seen significant gains in real gross domestic product (GDP) per capita, coinciding with development of the Bakken shale play. In 2001, North Dakota's GDP per capita was well below the U.S. average, ranking 38th out of 50 states. Starting in 2004, the state's GDP per capita rose consistently each year, eventually surpassing the U.S. average in 2008. By 2012, its real GDP per capita was $55,250, more than 29% above the national average. Even though the state appeared to be closing the gap on the U.S. average before Bakken production began, the rising oil and gas production likely contributed to the economic growth the state has enjoyed.
In 2012, North Dakota reported the highest annual increase in real per capita GDP of any state in the country for the second consecutive year. In 2012, real per capita GDP in North Dakota increased by nearly 11% from the previous year, according to statistics released June 6, 2013 by the U.S. Bureau of Economic Analysis (BEA). This is considerably higher than the national growth rate of less than 2% and is more than three times as large as the growth rate in Texas (3.27%), the state with the next highest annual growth.
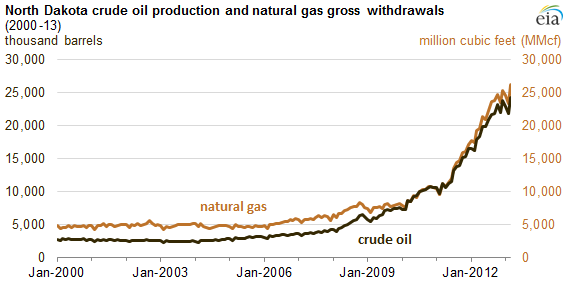
Real per capita GDP has been rising steadily for the past decade in North Dakota, even as incomes around the rest of the country have fluctuated. Particularly high growth started in 2007, when increased production of oil and natural gas in the Bakken region was made possible by advancements in horizontal drilling and hydraulic fracturing practices. Between 2007 and 2012, annual crude oil production in the state increased fivefold, and annual natural gas gross withdrawals more than tripled. As a result, the real GDP of the state mining industry has grown by nearly 42% in the past year with a compound annual growth rate of about 39% between 2007 and 2012. This has led to increased demand for electricity by the industrial sector, and is spurring development of new oil and gas infrastructure.
Development in the mining industry has attracted further investment in other sectors of the state economy. Transportation is an integral part of the production process for the mining industry. Hundreds of truckloads of materials are needed for the hydraulic fracturing process to begin production from a well, and afterward, about 75% of what is produced is transported by truck. Between 2007 and 2012, the transportation and warehousing industry in North Dakota has seen a compound annual growth rate of about 16%, with a 35% increase in 2012 alone.
North Dakota's population increased as the mining and transportation industries were developed. In 2012, the U.S. Census Bureau reported North Dakota as having the highest population growth rate in the country, averaging more than 2% between July 1, 2011, and July 1, 2012. The accommodation and food services industry and the real estate industry have also grown, expanding at annual compound growth rates of 7% and 9%, respectively, from 2007 to 2012.