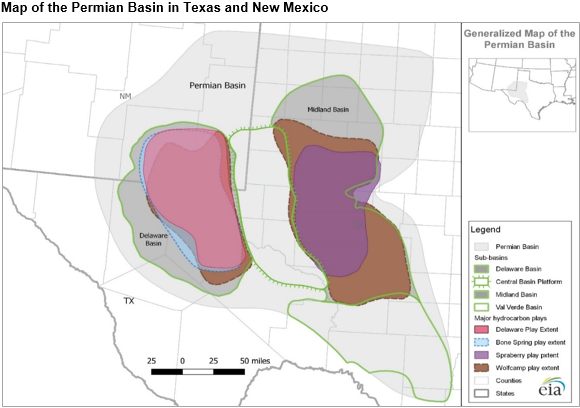
Drilling and completion improvements support Permian Basin hydrocarbon production

The Permian Basin, which spans western Texas and eastern New Mexico, represents the most prolific hydrocarbon production region in the United States. They accounted for about 30% of U.S. crude oil production and 14% of U.S. natural gas production (measured as gross withdrawals) in 2020. Technology innovations, such as longer lateral wells and multi-well pad drilling, has helped reduce costs and increase productivity in developing oil and natural gas resources in the Permian Basin.
The Delaware Basin and Midland Basin are parts of the greater Permian Basin and contain multiple stacked reservoirs. As of June 2021, the Delaware Basin had 17,450 producing wells and the Midland Basin had 27,540 producing wells, which have been installed since January 2011, according to data from Enverus. In June 2021, horizontal wells accounted for 84% of the producing wells in the Delaware Basin and 86% of the producing wells in the Midland Basin.
Operators continue to drill longer horizontal segments, or laterals, for wells in the stacked reservoirs of the Delaware Basin and Midland Basin. The share of wells with 11,000-foot or longer lateral segments increased from less than 1% in 2014 to around 20% in 2021 across the entire Permian Basin. Currently, exploration and production companies operating in the Permian Basin are successfully testing laterals of more than 15,000 feet. In the first half of 2021, Midland wells averaged lateral lengths of 10,000 feet, while Delaware wells averaged lateral lengths of 8,700 feet. Although well lateral length is still increasing, proppant and fluid use has not changed significantly since 2017.

Multi-well pad drilling allows multiple wells to be drilled from a single drill site, or pad. Drilling multiple wells from a single pad increases reservoir penetration with minimal surface disturbance, but it also poses challenges for well spacing optimization, the risk of wellbore collision during drilling, and production interference during simultaneous hydraulic fracturing. In the first half of 2021, 25% of pads in the Midland Basin and Delaware Basin contained at least nine wells, according to data from Enverus.
Principal contributors: Olga Popova, Gary Long
Tags: natural gas, Texas, liquid fuels, oil/petroleum, states, New Mexico, map