
Retail gasoline prices in the Rocky Mountains fall as U.S. average prices rise
Download CSV Data
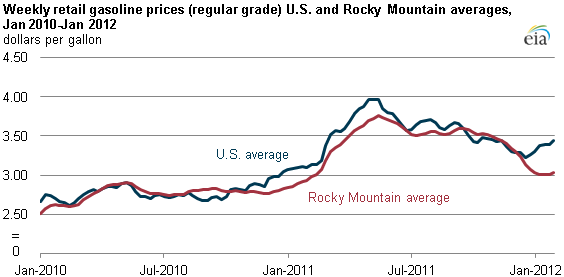
The average price for a gallon of regular gasoline in the Rocky Mountain region fell from $3.35 per gallon just after Thanksgiving to $3.03 per gallon at the end of January, a drop of 32 cents. Over the same period, the average gasoline price for the United States as a whole increased 13 cents, from $3.31 per gallon to $3.44 per gallon. In general, gasoline prices in the Rocky Mountain area have been lower than the national average for much of the past year due to relatively low crude oil input costs to refineries in a region that is fairly self-sufficient in meeting its demand for gasoline and other petroleum products; refineries within the Rockies supply most of the regional demand.
On January 30, 2012, average gasoline prices in the Rockies were 41 cents below the U.S. average, which was a record for the region since EIA began tracking regional retail price data in 1992. These low prices can partially be attributed to a recent increase in refinery inputs for the region. After spending most of 2011 below seasonally-normal levels, in September, gross inputs into refineries in the Rockies fell sharply to about 12% below their five-year average. During the fourth quarter of 2011 gross inputs in the Rockies recovered to above-average levels. However, in January 2012, refinery inputs in the Rockies surged, averaging 10% above their five-year average. These increased inputs have kept the region well-supplied, with gasoline inventories 12% above their five-year average as of January 27, 2012.
In contrast to the eastern half of the United States, the gasoline market in the Rocky Mountain region is fairly self-sufficient. Refineries within the Rockies use crude oil produced within the region, the neighboring Midwest region, or imported from Canada. Over the past year, due to transportation constraints and increasing production, these crude oils have tended to sell at a discount to many other crude oils. Prior to 2011, refineries in the Rockies generally paid about $3 less per barrel for their crude oil than the average U.S. refinery. However, through the first 11 months of 2011 this difference grew to an average discount of $14 per barrel. In November 2011, the most recent month for which EIA has data, the gap was $16 per barrel. These lower crude oil costs have created generally lower-than-average retail gasoline prices in the Rockies for most of 2011.
While EIA does not have data beyond November, it is likely that crude oil in the Rockies compared to the rest of the country became even cheaper in January as spot prices for some Canadian crude oils and Bakken crude oil became more steeply discounted compared to many crudes used by U.S. refiners in other parts of the country. Canadian and Bakken crude oils are more indicative of crude oil input costs in the Rockies than crudes such as West Texas Intermediate (WTI) and Louisiana Light Sweet (LLS), which are more widely used in the Midwest and Gulf Coast, respectively. These recent price declines may have provided additional impetus for the sharp decline in Rocky Mountain gasoline prices.
The map below displays ranges of U.S. retail regular unleaded gasoline prices by county. Average retail gasoline prices in the Rocky Mountain states are lower than those found elsewhere in the country.
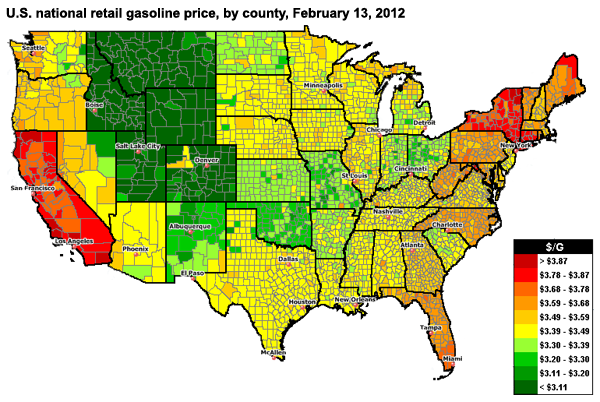
Note: GasBuddy.com is a group of local websites that offers an online method for website visitors to post and view recent retail gasoline prices.
Tags: crude oil, gasoline, map, oil/petroleum, prices, production/supply, refining, states, transportation