Menu
Crude oil, gasoline, heating oil, diesel, propane, and other liquids including biofuels and natural gas liquids.
Exploration and reserves, storage, imports and exports, production, prices, sales.
Sales, revenue and prices, power plants, fuel use, stocks, generation, trade, demand & emissions.
Energy use in homes, commercial buildings, manufacturing, and transportation.
Reserves, production, prices, employment and productivity, distribution, stocks, imports and exports.
Includes hydropower, solar, wind, geothermal, biomass and ethanol.
Uranium fuel, nuclear reactors, generation, spent fuel.
Comprehensive data summaries, comparisons, analysis, and projections integrated across all energy sources.
Monthly and yearly energy forecasts, analysis of energy topics, financial analysis, congressional reports.
Financial market analysis and financial data for major energy companies.
Greenhouse gas data, voluntary reporting, electric power plant emissions.
Maps, tools, and resources related to energy disruptions and infrastructure.
State energy information, including overviews, rankings, data, and analyses.
Maps by energy source and topic, includes forecast maps.
International energy information, including overviews, rankings, data, and analyses.
Regional energy information including dashboards, maps, data, and analyses.
Tools to customize searches, view specific data sets, study detailed documentation, and access time-series data.
EIA's free and open data available as API, Excel add-in, bulk files, and widgets
Come test out some of the products still in development and let us know what you think!
EIA's open source code, available on GitHub.
Forms EIA uses to collect energy data including descriptions, links to survey instructions, and additional information.
Sign up for email subscriptions to receive messages about specific EIA products
Subscribe to feeds for updates on EIA products including Today in Energy and What's New.
Short, timely articles with graphics on energy, facts, issues, and trends.
Lesson plans, science fair experiments, field trips, teacher guide, and career corner.
EIA is continuing normal publication schedules and data collection until further notice.
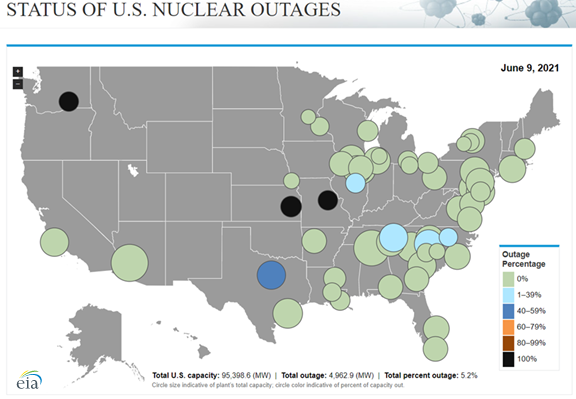
Every morning, each nuclear electricity generator in the United States reports its operating status to the Nuclear Regulatory Commission (NRC). The NRC compiles this information in its Power Reactor Status Report, and we present that information in interactive visualizations on our Status of Nuclear Outages page. Our analysis tool combines the NRC daily status with data gathered from our Annual Electric Generator Report and Monthly Update to the Annual Electric Generator Report. The page includes two maps showing the capacity and outage status of U.S. nuclear plants.
Nuclear power reactors are typically refueled every 18 to 24 months. Although the refueling process can be completed in as few as 10 days, outage periods are typically longer because of noncritical maintenance that is completed concurrently with refueling to minimize downtime over the course of the year.
Nuclear generators typically operate at or near maximum capacity. Nuclear plant operators generally schedule refueling outages for the fall and spring months, sometimes referred to as shoulder months, when the demand for electricity is usually lowest because demand for heating and cooling is lower.
Although we launched the Status of Nuclear Outages page in 2015, it includes NRC’s daily information on nuclear reactor status back to January 1, 2007. The page shows the magnitude of outages but does not provide information on the cause of those outages. The NRC makes additional plant status information available four weeks after the outage is initially reported.
Principal contributor: EIA Staff
Tags: generation, electricity, nuclear, outages