
U.S. energy consumption in 2020 increased for renewables, fell for all other fuels
Note: Click to enlarge.
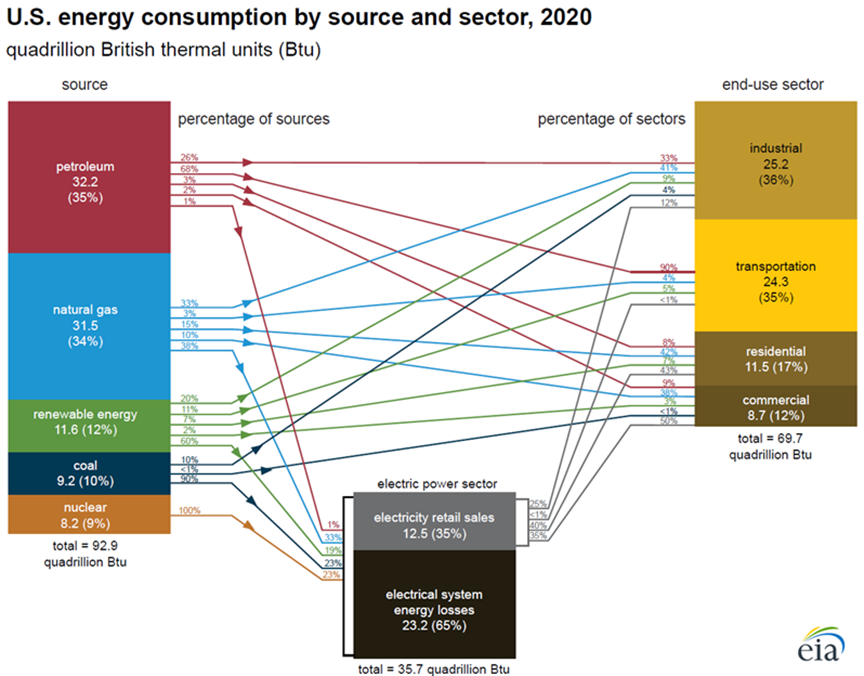
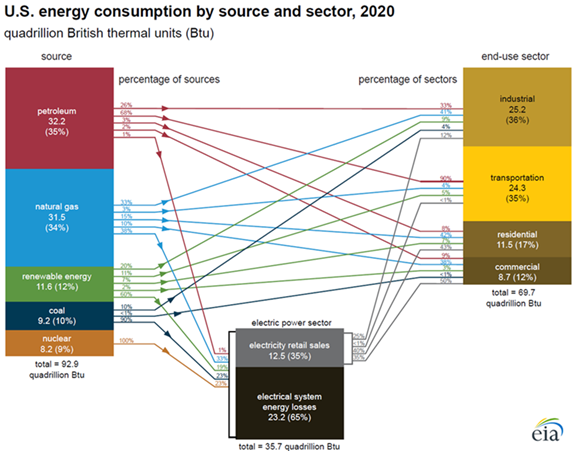
We recently updated our U.S. energy consumption by source and sector chart with 2020 data. All sources for U.S. energy consumption totaled 92.9 quadrillion British thermal units (quads) in 2020, a record 7% decrease from 2019. Consumption decreased for all fuels compared with 2019 except renewable energy, which increased by 2%. Petroleum consumption decreased 13%, natural gas decreased 2%, coal decreased 19%, and nuclear electric power decreased 2%.
We convert sources of energy to common units of heat, called British thermal units (Btu), to compare different types of energy that are usually measured in units that are not directly comparable, such as gallons of biofuels compared with kilowatthours of wind energy.
We use a fossil fuel equivalence to calculate primary energy consumption of noncombustible renewables (wind, hydro, solar, and geothermal), which are not burned to generate electricity and therefore do not have an inherent Btu conversion rate. In this approach, we convert the noncombustible renewables from kilowatthours to Btu using the annual weighted-average Btu conversion rate for all fossil fuels burned to generate electricity in the United States during that year to estimate the amount of fossil energy replaced by these renewable sources.
We use the fossil fuel equivalency approach to report noncombustible renewables’ contribution to total primary energy, in part, because the resulting shares of primary energy are closer to the shares of generated electricity. This calculation also represents the energy that would have been consumed if the electricity from renewable sources had instead been generated by a mix of fossil fuels.
Note: Electric power sector data include electrical system energy losses.
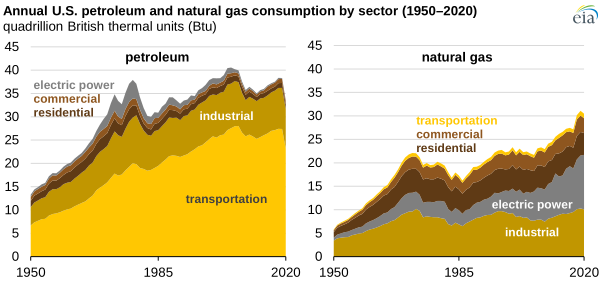
The transportation sector typically accounts for about 70% of U.S. petroleum consumption, and the industrial sector accounts for most of the rest. In 2020, U.S. petroleum consumption for transportation fell by 16%, or more than 4 quads, from 2019 levels. Petroleum consumption fell less than 1 quad each in the industrial, residential, and commercial sectors.
The share of natural gas consumed by the electric power sector in the United States has grown over time. In 2000, the electricity sector accounted for 22% of U.S. natural gas consumption; by 2020, that share had risen to 38%. Natural gas consumption in the residential and commercial sectors fluctuates with weather conditions because its main direct use in those sectors is for heating.
The electric power sector has typically accounted for one-half or more of U.S. renewable energy consumption since the 1960s. In 2020, the sector consumed 60% of all renewable energy used in the nation, a level last reached in 1998. The industrial sector’s share of U.S. renewable consumption has fallen from about 30% to 20% in the last 15 years. In that time, the transportation sector’s share has grown to more than 10%, mostly because of increased fuel ethanol consumption. U.S. residential and commercial sectors consistently account for less than 10% of combined U.S. renewable consumption.
The electric power sector consistently accounts for about 90% of U.S. coal consumption, and the industrial sector accounts for most of the rest. Overall, in 2020, consumption of energy by the U.S. electric power sector declined by 3%.
In 2020, U.S. energy consumption decreased in all four end-use sectors after accounting for electrical system energy losses. Transportation sector consumption fell 14% from 2019 levels, the industrial sector declined by 4%, the residential sector by 3%, and the commercial sector by 7%. Industrial sector consumption exceeded transportation sector consumption for the first time since 1999 after accounting for energy losses.
Principal contributor: Allen McFarland
Tags: consumption/demand, total energy, renewables