
U.S. average gasoline prices and vehicle travel fell to multiyear lows in 2020
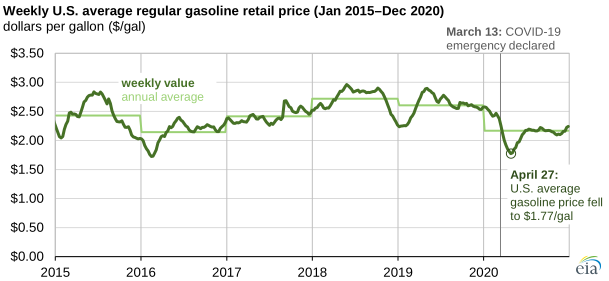
U.S. regular retail gasoline prices averaged $2.17 per gallon (gal) in 2020, 44 cents/gal (17%) lower than in 2019 and the lowest annual average since 2016. Gasoline prices at the beginning of the year were more than $2.50/gal; however, responses to the COVID-19 pandemic resulted in widespread reductions in passenger travel and gasoline demand, contributing to lower gasoline prices across the United States.
U.S. gasoline prices averaged $2.38/gal in mid-March, just before a national emergency was declared. Gasoline prices fell for several consecutive weeks, ultimately reaching $1.77/gal on April 27, the lowest average price since early 2016, according to the U.S. Energy Information Administration’s (EIA) Gasoline and Diesel Fuel Update. Vehicle travel in April fell to its lowest monthly level on record, according to a Bureau of Transportation Statistics data series that dates back to 2000.
Vehicle travel and gasoline demand (measured as product supplied) began to increase in May, relative to April levels. From May through the end of the summer, U.S. gasoline inventories remained high because of sustained lower demand, even as refiners reduced gasoline production because of lower margins.
In most years, U.S. gasoline prices tend to be highest in the summer, when gasoline demand is usually higher. However, in 2020, U.S. gasoline prices were highest at the beginning of the year. Of the 10 cities surveyed in EIA’s Gasoline and Diesel Fuel Update, 8 cities registered their highest gasoline prices for the year on January 6, and the remaining 2 cities (Chicago and Houston) registered their annual highs the following week, on January 13.
Gasoline prices in Boston, Chicago, Cleveland, and San Francisco reached their annual lows on April 27, and gasoline prices in Denver, Los Angeles, New York, and Seattle reached their annual lows the following week, on May 4. The lowest gasoline prices of the year in the remaining two cities (Houston and Miami) occurred two weeks later, on May 18.
Principal contributor: Kevin Hack
Tags: prices, gasoline, liquid fuels