EIA updates geological maps of Midland Basin’s Wolfcamp formation
Note: Click to see full-size images, starting from top left: 1, 2, 3, 4, 5, 6, 7, 8.
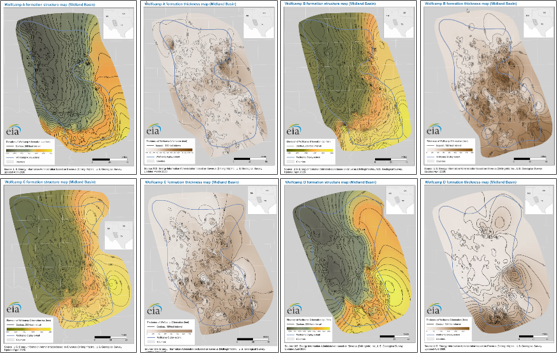
The U.S. Energy Information Administration (EIA) has released new structure and thickness maps for the Wolfcamp play in the Midland Basin, which is a part of the larger Permian Basin in western Texas and southeastern New Mexico. The Wolfcamp formation has attracted many oil companies because of its stacked potential (that is, multiple hydrocarbon-producing zones on top of one another).
The stacked Wolfcamp formation has four intervals, called benches, which are designated from top to bottom as A, B, C, and D. Each bench displays different characteristics in terms of lithology (the physical characteristics of rocks), total organic carbon content, and thermal maturity. Most of the current drilling activities in the Midland Basin target the upper Wolfcamp A and B benches. In 2019, A and B benches generated 95% of total Wolfcamp hydrocarbon production in the Midland Basin.
Structure and thickness maps are key elements in resource estimation and in defining the areas where hydrocarbon extraction is economical. Of the producing shale formations that comprise the Midland Basin, the Wolfcamp is the deepest and thickest but varies significantly across the basin. Wolfcamp subsea depth varies from -2,000 feet in the east along the Eastern Shelf to -7,000 feet along the basin axis, near the western basin edge. The thickness of the entire Wolfcamp formation ranges from 950 feet to more than 3,600 feet in the Midland Basin, and the thickest areas are in the east along the Eastern Shelf.
EIA’s illustrations show the top and bottom of the formations as 3-D surfaces. These illustrations give an estimation of subsurface formation volumes and can help detect regional structural and tectonic features such as major faults, folds, and thrusts.
Sandstone layers of the Wolfcamp formation have produced oil and natural gas from vertical wells throughout the Midland Basin since the late 1940s. A decade ago, hydraulic fracturing stimulation techniques opened up the low permeability shale zones of the Wolfcamp formation to hydrocarbon production. These expanded productive intervals are called the Wolfcamp play. More than 8,800 Wolfcamp horizontal wells were completed in the Midland Basin from 2010 through July 2020.
EIA’s Maps: Oil and Gas Exploration, Resources, and Production page lists the maps EIA has added or updated for Wolfcamp and other major shale plays.
Principal contributors: Olga Popova, Emily Geary, April Patel, Gary Long
Tags: natural gas, Texas, liquid fuels, oil/petroleum, states, New Mexico, map