Six formations are responsible for surge in Permian Basin crude oil production
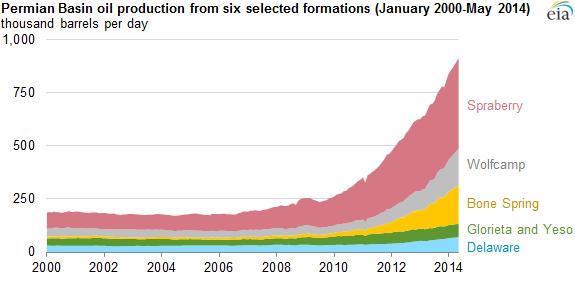
Note: Production through December 2013 is reported. Production from January 2014 through May 2014 is estimated. Glorieta and Yeso are separate formations combined for this article. Additional amounts of Permian production come from other formations not included in this graph.
The Permian Basin in Texas and New Mexico is the nation's most prolific oil producing area. Six formations within the basin have provided the bulk of Permian's 60% increase in oil output since 2007. Crude oil production in the Permian Basin has increased from a low point of 850,000 barrels per day (bbl/d) in 2007 to 1,350,000 bbl/d in 2013.
Largely as a result of this growth, crude oil production from Permian Basin counties has exceeded production from the federal offshore Gulf of Mexico region since March 2013, making the Permian the largest crude oil producing region in the United States. In 2013, the Permian Basin accounted for 18% of total U.S. crude oil production. The recent increase in Permian crude oil production is largely concentrated in six low-permeability formations that include the Spraberry, Wolfcamp, Bone Spring, Glorieta, Yeso, and Delaware formations. Production from these formations has helped drive the increase in Permian oil production—particularly since 2009—despite declining production from legacy wells.
Almost three-quarters of the increase in Permian crude oil production came from the Spraberry, Wolfcamp, and Bone Spring formations. Counties in these three formations have driven the increase in the Permian Basin's horizontal, oil-directed rig activity in recent months. Production from these three formations collectively increased from about 140,000 bbl/d in 2007 to an estimated 600,000 bbl/d in 2013, increasing their share of total Permian oil production from 16% to 44%. Three other formations—the Delaware formation and the adjacent Glorieta and Yeso formations—also increased production from 2007 to 2013, but to a lesser extent. Production from these three formations rose from 61,000 bbl/d in 2007 to an estimated 112,000 bbl/d in 2013.
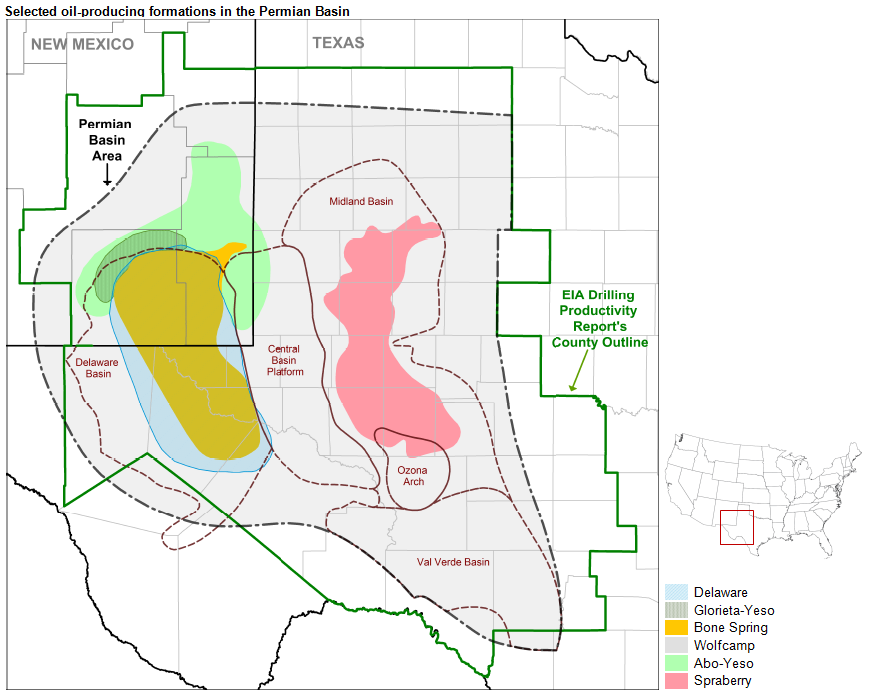
The Permian Basin region encompasses an area approximately 250 miles wide and 300 miles long, and it contains many potentially productive low-permeability oil formations. Although oil production has previously come from the more permeable portions of the Permian formations, the application of horizontal drilling and hydraulic fracturing has opened up large and less-permeable portions of these formations to commercial production. This is especially true for the Spraberry, Wolfcamp, and Bone Spring formations, which have initial well production rates comparable to those found in the Bakken and Eagle Ford shale formations.
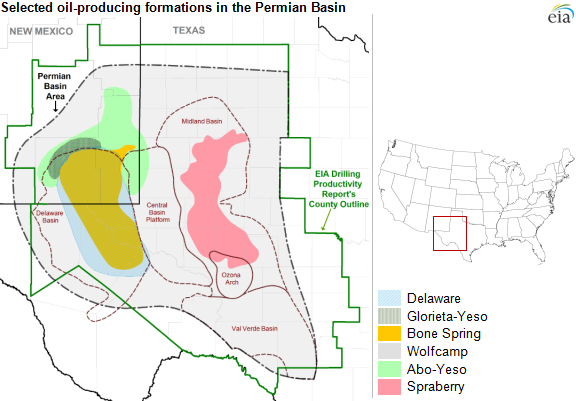
Note: Wolfcamp is found throughout the entire Permian Basin area.
Note: Click to enlarge.
Principal contributors: Philip Budzik, Jack Perrin
Tags: drilling, liquid fuels, map, oil/petroleum, production/supply, Texas