
U.S. Henry Hub natural gas spot prices reached record lows in the first half of 2020
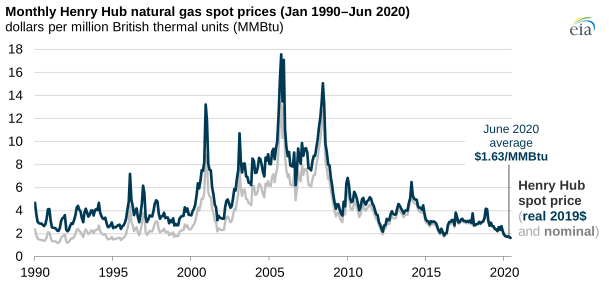
In the first half of 2020, natural gas prices at the U.S. Henry Hub benchmark reached record lows. The average monthly Henry Hub spot price in the first six months of the year was $1.81 per million British thermal units (MMBtu). Monthly prices reached a low of $1.63/MMBtu in June, the lowest monthly inflation-adjusted (real) price since at least 1989. Prices started the year low because of mild winter weather, which resulted in less natural gas demand for space heating. Beginning in March, spring weather and the economic slowdown induced by mitigation efforts for the coronavirus disease 2019 (COVID-19) contributed to lower demand, further lowering prices.
Warmer-than-normal temperatures in January through March resulted in more natural gas than average in underground storage at the end of the heating season. The traditional heating season runs between November 1 and March 31. Injections into underground storage so far during the 2020 refill season (April 1 to October 31) have also been relatively high, lagging behind only 2019 and 2015 for total net injections for the Lower 48 states through May. High storage levels indicate high natural gas production relative to consumer demand.
Contributing to high U.S. storage levels and lower prices has been a decline in liquefied natural gas (LNG) exports. Demand for U.S. liquefied natural gas exports has fallen by half in the first half of 2020, from 9.8 billion cubic feet per day (Bcf/d) in late March to less than 4.0 Bcf/d in June. U.S. industrial demand is down by 0.6 Bcf/d, or 2.7%, compared with the first half of 2019.
The monthly average Henry Hub price was less than $2/MMBtu in each month from February through June. Before 2020, the real Henry Hub price averaged less than $2/MMBtu in one month: March 2016. The daily Henry Hub price reached its lowest level in more than 20 years on June 16, 2020, settling at $1.38/MMBtu, according to Natural Gas Intelligence.
Prices at key trading hubs across the country have generally traded close to the Henry Hub basis, and they are largely driven by regional temperatures. Except for California, prices at all major trading hubs in population centers averaged less than $2/MMBtu in the first half of 2020. Prices at PG& Citygate in Northern California and SoCal Citygate in Southern California averaged $2.57/MMBtu and $2.35/MMBtu, respectively.
The mild winter this year helped keep the natural gas price at the Algonquin Citygate in New England relatively low, averaging $1.88/MMBtu in the first half of the year. Algonquin natural gas prices are often significantly higher than Henry Hub in the winter because of pipeline constraints.
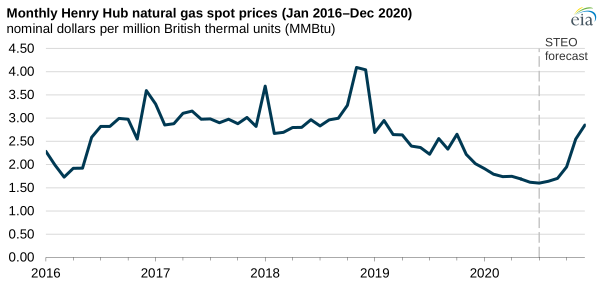
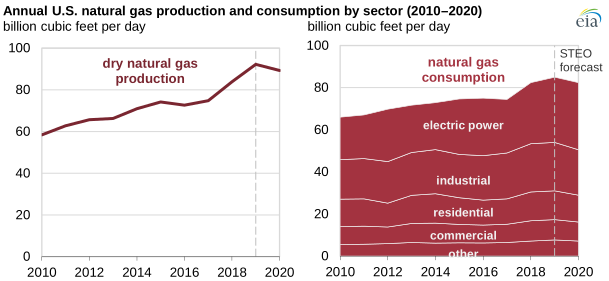
The U.S. Energy Information Administration (EIA) expects natural gas prices to stay low in the coming months before eventually increasing by the end of 2020. In its July 2020 Short-Term Energy Outlook (STEO), EIA forecasts the Henry Hub natural gas spot price for the second half of this year will average $2.05/MMBtu. By the fall, EIA expects low prices to lead to further declines in natural gas production as a result of lags between natural gas price changes and adjustments to production levels. EIA expects U.S. dry natural gas production to decrease by 3% to average 89.2 Bcf/d in 2020, down from 92.2 Bcf/d in 2019.
EIA expects that the low price of natural gas will encourage more natural gas consumption in the electric power sector in 2020, which is already 7% higher in the first half of 2020 compared with last year. EIA expects consumption in all other sectors to decline and that overall 2020 natural gas consumption will decline by 3 Bcf/d. EIA expects natural gas spot prices to rise by the fourth quarter of 2020 as production falls and the winter heating season begins.
Principal contributors: Kristen Tsai, Stephen York
Tags: natural gas, spot prices, Henry Hub