
Most new utility-scale solar in the United States is being built in the South Atlantic
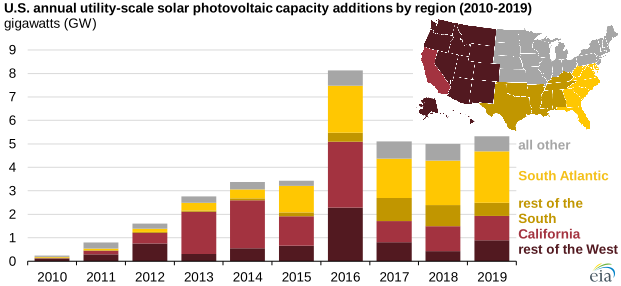
In the past three years, the South Atlantic region of the United States installed more new utility-scale solar photovoltaic (PV) capacity than any other region of the country. States in the South Atlantic region installed 2.2 gigawatts (GW) of new solar capacity in 2019, more than double the 1.0 GW installed in California, which had the second-highest new solar capacity additions. Despite being home to the strong sun states of Arizona, New Mexico, and Nevada, at 0.9 GW, less solar capacity was installed in the rest of the West region in 2019 than in either the South Atlantic or in California.
Growth in South Atlantic solar generating capacity has been driven by state government programs and policies in North Carolina, Florida, Georgia, and South Carolina. These state programs and policies encourage large-scale installation of renewable energy technologies such as solar PV.
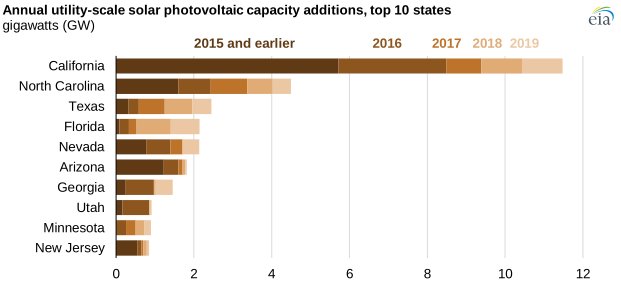
In 2007, North Carolina became the first state in the Southeast to adopt a clean energy requirement, which has been spurring the state's growth in solar installations. From 2016 through 2019, North Carolina led the Southeast states with 2.9 GW of solar capacity additions, and it had the second-highest new solar capacity additions in the country after California. Florida and Georgia have also seen strong recent growth in solar installations. Since 2016, 2.1 GW of solar capacity has been installed in Florida and 1.2 GW in Georgia.
Texas, in the South region, is also becoming one of the nation’s leading solar states. From 2016 to 2019, 2.1 GW of utility-scale solar PV capacity was installed in Texas, making it the third-ranking state in total installations behind California (5.8 GW) and North Carolina (2.9 GW).
California, a long-running state leader in solar energy, accounted for almost one-quarter of the total utility-scale solar PV capacity additions in the United States between 2016 and 2019.
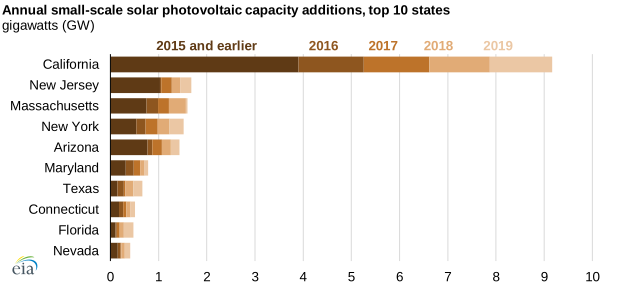
Utility-scale projects are responsible for most of the solar capacity growth in the South Atlantic region, which has lower levels of small-scale installations. California dominates small-scale solar installations, housing almost 40% of all small-scale solar PV capacity in the United States. From 2016 to 2019, California added 5.3 GW of new small-scale solar capacity, more than any other state.
In addition to a large population base and abundant sunshine, California’s strong government policies, programs, and incentives have driven both small-scale and utility-scale solar growth. This trend is expected to continue as a result of the new California solar requirement that went into effect at the beginning of 2020. Most new homes built in the state must now have a solar PV system, which is driving continued small-scale solar capacity growth in California and the Pacific region.
Principal contributors: Fred Mayes, Richard Bowers
Tags: generation, electricity, solar, capacity