
Spread between WTI and Brent prices narrows on signs of easing transportation constraints
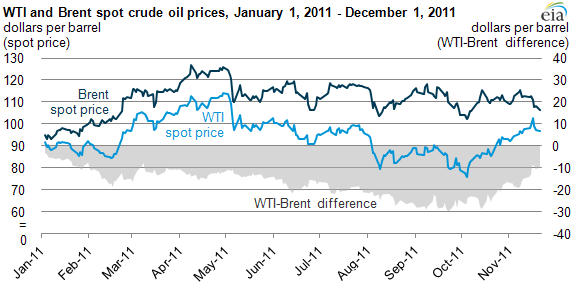
Between October and November, the spot price of West Texas Intermediate (WTI) crude oil increased $23 per barrel partly on signs that transportation constraints out of the U.S. Midwest, the main market for WTI, are beginning to ease. At the same time, the price of European benchmark Brent crude oil was up much less, only about $7 per barrel. As a result, the WTI-Brent crude oil price difference has narrowed. The WTI-Brent crude oil price difference was smaller earlier in the year. While the WTI-Brent oil price narrowed, gasoline prices continue to track the price of Brent as they have for much of the year. The average price for gasoline moved about 6 cents a gallon from early October through mid November and then fell 13 cents during the last two weeks of November.
On November 16, 2011, ConocoPhillips announced it was selling its 50% share of the Seaway crude oil pipeline to Enbridge, Inc. The Seaway Pipeline links markets in the Houston area with oil storage facilities near Cushing, Oklahoma. Enbridge and Enterprise Products Partners, the other joint owner of Seaway, announced that they intended to reverse oil flows to run north to south starting as early as second quarter of 2012. The flow reversal may partially alleviate a transportation constraint by allowing crude oil to move from the Cushing hub to refineries located on the U.S. Gulf Coast. Following the announcement of the reversal, the difference between the spot price of Brent crude oil and WTI fell to under $10 per barrel after reaching a record of $29.70 per barrel on September 22, 2011.
Over the past year, increasing volumes of crude oil production from Canada and the Bakken shale formation moved into the Midwest market, which includes Cushing, the delivery point for the NYMEX light, sweet crude oil futures contract. These increasing supplies moderated the price of WTI crude oil, keeping it at a historic discount to globally traded waterborne crudes such as Brent.
The proposed reversed Seaway Pipeline is slated to initially transport up to 150,000 barrels per day (bbl/d) of crude oil from Cushing, OK to the Gulf Coast. Current plans include increasing capacity to 400,000 bbl/d by 2013. The ability to ship crude oil out of Cushing via pipeline will allow WTI and similar inland U.S. crudes to compete directly with the higher priced waterborne crude oils on the Gulf Coast (whose prices closely follow Brent), bringing the price of WTI more in line with global markets. Currently, the market relies on high-cost rail and trucks to ship both crude oil stored at Cushing and production from Canada and the Bakken formation to the Gulf Coast.
The reversal of the Seaway Pipeline will not eliminate bottlenecks moving WTI's crude oil to downstream markets. With crude oil production increases from Canada and the Bakken and other shale formations in the coming years expected to continue, the market will still be dependent on rail as the marginal mode of transportation, meaning some discount will be required to account for the costs of moving inland US crudes to the Gulf Coast.