
EIA’s new Key Statistics and Indicators section highlights long-term state energy data
EIA recently released a new Key Statistics and Indicators section in the State Energy Data System (SEDS), EIA’s comprehensive source for annual state energy statistics. The new section makes complete time-series data by state easier to access and provides state rankings tables for the most current year. Data in the Key Statistics and Indicators section cover energy consumption and production series from 1960 to 2016 and prices and expenditures series from 1970 to 2016.
EIA maintains SEDS for analysis and forecasting purposes. Within SEDS, historical data for energy production, consumption, prices, and expenditures by state are defined as consistently as possible over time and across sectors for analysis and forecasting purposes.
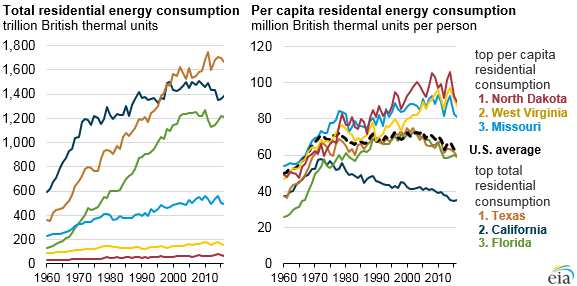
State-level estimates of total and per capita energy consumption in the residential sector are among the data featured in the Key Statistics and Indicators section. Texas and California have long been among the states with the highest total residential sector energy consumption, and they were ranked first and second, respectively, in 2016. Florida’s population has quadrupled since 1960, driving an increase in residential sector consumption and moving the state from 23rd highest in 1960 to 3rd highest in 2016. Per capita residential energy consumption in each of these three states has fallen in the past decade, consistent with the overall national trend. The states with the highest per capita residential energy consumption in 2016 were North Dakota, West Virginia, and Missouri.
Other key energy statistics by state include
- Total energy consumption in the commercial, industrial, and transportation sectors
- Energy consumption by source
- Energy prices and expenditures
- Primary energy production for fossil fuels, nuclear energy, and renewable energy
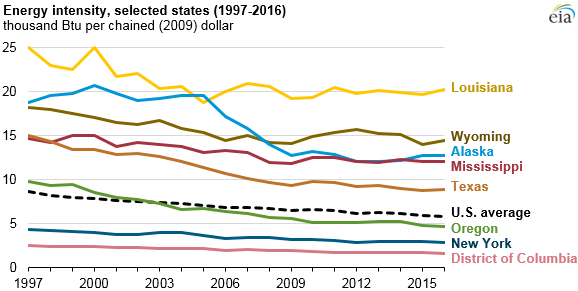
Energy intensity—calculated as total energy consumption divided by real gross domestic product (GDP)—is a common energy indicator and efficiency measure. Louisiana, consistently the state with the highest energy intensity, was the 4th highest energy-consuming state in 2016 and the 24th highest in terms of real GDP. States with high energy intensity, such as Louisiana, Wyoming, Alaska, and Mississippi, all have energy-intensive industrial sectors and are top fossil fuel energy producers.
States with concentrated urban areas and relatively small industrial sectors tend to have lower energy intensities. New York has had the lowest energy intensity of any state since 1997, the earliest year on record. The energy intensity of the District of Columbia has consistently been lower than that of any state. Oregon is the only state that was higher than the U.S. average energy intensity in 1997 but is now lower than the U.S. average.
Analysts using SEDS will be able to examine other key energy indicators such as
- Real gross domestic product (GDP)
- Energy consumption per capita
- Energy intensity (total energy consumption per real dollar of GDP)
- Energy expenditures per capita
- Energy expenditures per current-dollar GDP
- Motor gasoline expenditures per capita
EIA is releasing estimates by energy source for 2017 and revisions for previous years in installments; the full release schedule is available on the SEDS updates page. The full set of final 2017 SEDS reports will be released at the end of June 2019.
EIA will update the SEDS Key Statistics and Indicators section with the release of the full annual SEDS reports. EIA welcomes suggestions for new state-level energy indicators.
Principal contributor: Mickey Francis