Future U.S. electricity generation mix will depend largely on natural gas prices
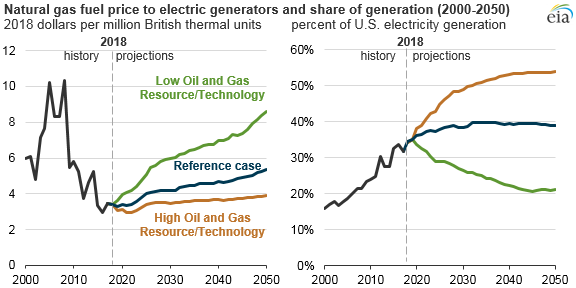
The mix of fuels used to generate electricity in the United States has changed in response to differences in the relative costs of electricity-generating technologies and their fuels. EIA’s Annual Energy Outlook 2019 (AEO2019) shows that projected generation and capacity is significantly influenced by natural gas prices. In the High Oil and Gas Resource and Technology scenario, a sensitivity case with low natural gas prices, natural gas provides 54% of all U.S. electricity generation by the end of the projection period. In the Low Oil and Gas Resource and Technology scenario, a corresponding sensitivity case with high natural gas prices, the natural gas generation share falls to 21%.
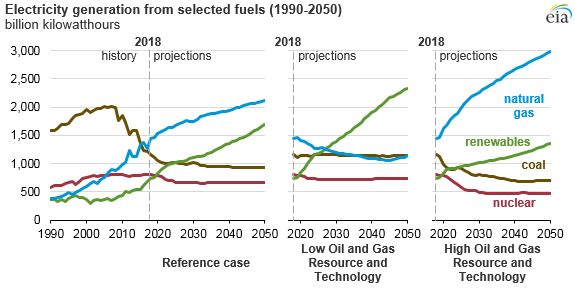
On an annual basis, natural gas surpassed coal in 2016 as the fuel most used to generate electricity in the United States. In the AEO2019 Reference case, natural gas remains the leading source of electricity generation through 2050. In 2018, natural gas accounted for 34% of total electricity generation, and EIA projects its share to grow to 40% by 2032 and then remain between 39% and 40% throughout 2050. Electricity generation shares from coal and nuclear gradually decline as coal and nuclear become less cost competitive compared with natural gas and renewables. Renewables generation surpasses nuclear by 2020 and surpasses coal by the mid-2020s as tax credits and lower capital costs drive solar photovoltaic and wind capacity additions.
The natural gas share of U.S. electricity generation largely depends on natural gas prices. Relatively low natural gas prices lead to higher utilization of existing plants and to more natural gas power plant construction. The price of natural gas delivered to electric power plants averaged $3.42 per million British thermal units (Btu) in 2018, and in the AEO2019 Reference case, EIA projects that it will average (in real dollar terms) $5.36 per million Btu in 2050.
In the Low Oil and Gas Resource and Technology case, higher extraction costs and lower resource availability result in less natural gas production, and the natural gas price for power plants increases to $8.62 per million Btu in 2050. Conversely, in the High Oil and Gas Resource and Technology case, which has the opposite assumptions for resource extraction costs and availability, EIA projects that natural gas prices will remain well below $4.00 per million Btu through 2050.
Because of lower natural gas prices, the share of natural gas-fired generation in the High Oil and Gas Resource and Technology case is considerably higher than in the Reference case, displacing renewables, coal-fired, and nuclear-powered generation. Natural gas-fired plants exceed renewables as the leading source of new capacity additions, and more existing coal-fired and nuclear-powered generation capacity is retired. Nuclear-powered electricity generation is lower in the High Oil and Gas Resource and Technology case because almost half of the current nuclear power plant fleet retires by 2050.
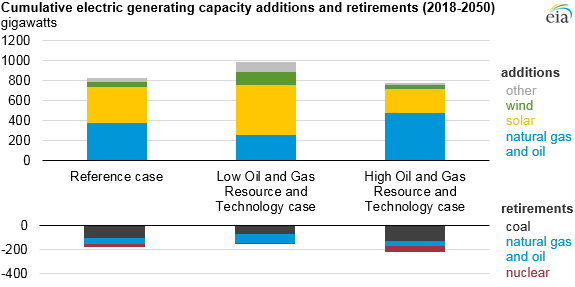
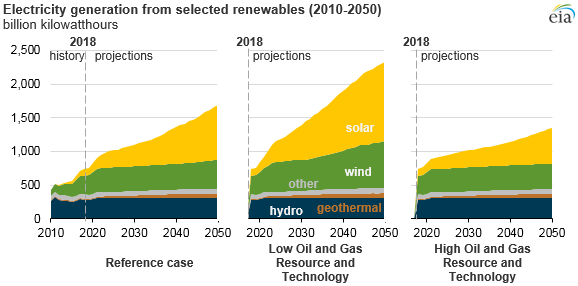
For the relatively high natural gas price environment in the Low Oil and Gas Resource and Technology case, natural gas-fired generation becomes less competitive with electricity generation from both renewables and coal-fired plants, resulting in renewables and coal-fired plants gaining market share. Increased additions of solar photovoltaic and wind capacity lead renewables technologies to become the predominant source of electricity generation in this case, first surpassing coal-fired plants as the primary source of generation by the mid-2020s and then exceeding natural gas-fired generation before 2030.
Compared with the Reference case, coal-fired generation is at a higher level because of fewer retirements and higher utilization rates for existing coal-fired generating plants. Coal and natural gas maintain similar shares of total generation (slightly more than 20%) through the last 10 years of the projection period, while the renewables share grows to 43%. Solar and wind provide 22% and 13% of U.S. electricity generation by 2050, respectively.
Principal contributors: Jeff Jones, Laura Martin